Real Estate Earnings Donut Chart – Predictable Investment Outcomes
RJ0900002_9
- Last Update 08/16/2025
- File Size 0.1MB
- # of Slides 2
- File Format PPTX
- Slide Ratio 16:9
- Color
Keywords
- #Content-Based Slides
- #Design-Based Slides
- #Market and Competitor Analysis
- #Financial Plans and Performance
- #Graph
- #Market Analysis
- #Projected Return on Investment (ROI)
- #Circles
- #Doughnut Chart
- #16:9
- #donut chart PowerPoint slide
- #pie chart template
- #ratio comparison slide
- #real estate investment PPT
- #how to create donut chart in PowerPoint
About the Product
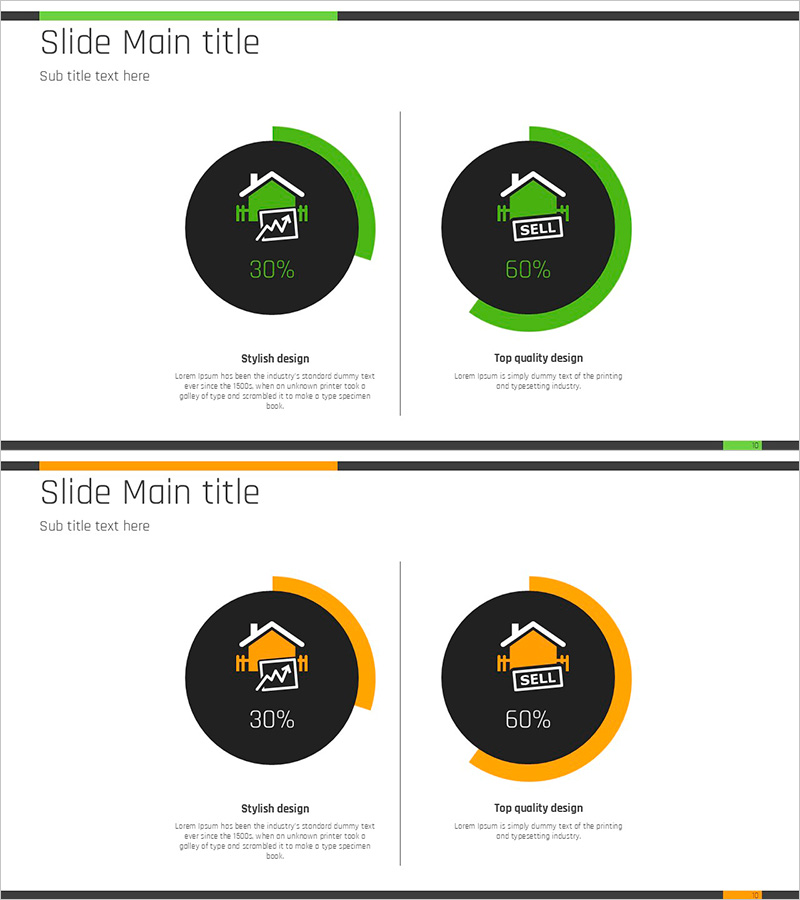
A donut chart PowerPoint slide designed for real estate investment revenue analysis. The lime green accent color contrasts sharply against the black background, clearly presenting data ratios for two revenue streams. Each chart section features an icon and percentage label for enhanced information clarity, making it ideal for investment proposals, financial reports, and performance presentations. The 16:9 widescreen format includes 2 slides in PPTX, with fully editable text, numbers, and color elements to match your presentation style.
Usage Points
-
Main Usage
Visualize two-category ratio data such as investment returns, sales performance, or market share using a donut chart. The centered icon identifies each category intuitively, while percentage labels provide precise numerical information for stakeholder presentations.
-
How to Use
Apply to investment proposal revenue sections, real estate marketing materials showing sales status, or quarterly performance reports comparing outcomes. Maintain the lime green accent or customize to your corporate brand colors for consistent presentation branding.
-
Recommended For
Real estate developers, investment firms, and financial institutions use this for executive presentations, sales team pitches, and analyst reports. Recommended for marketing plans, business reports, and shareholder meetings where revenue structure clarity is essential.
-
Slide Structure
Two-slide layout featuring dual donut charts per slide. Each chart consists of a black circular background, lime green arc-shaped data segments, centered icon, percentage value, and descriptive text area below for flexible content customization.
Related Products
-

Business Status Chart – Presentation Template for Market Analysis
#Market and Competitor Analysis #Diagram #Graph
-

Cosmetic Ingredient Ratio Chart – Doughnut Slide for Market Analysis
#Business Strategy #Market and Competitor Analysis #Graph
-

Sugar Usage Analysis Pie & Bar Graph Slide Template
#Market and Competitor Analysis #Graph #Market Analysis
-

Shareholder Status Distribution Analysis Chart – Visualizing Shareholder Information
#Company Introduction #Market and Competitor Analysis #Diagram
