Market Analysis Donut Chart & Table Slide
RM0400008_7
- Last Update 02/17/2025
- File Size 0.3MB
- # of Slides 2
- File Format PPTX
- Slide Ratio 16:9
- Color
Keywords
- #Content-Based Slides
- #Design-Based Slides
- #Market and Competitor Analysis
- #Diagram
- #Graph
- #Market Analysis
- #Market Overview
- #Table
- #Circles
- #Standard Table
- #Doughnut Chart
- #16:9
- #donut chart PowerPoint slide
- #pie chart alternative template
- #market segmentation chart
- #ratio visualization PPT
- #two-value comparison slide
- #data presentation template
About the Product
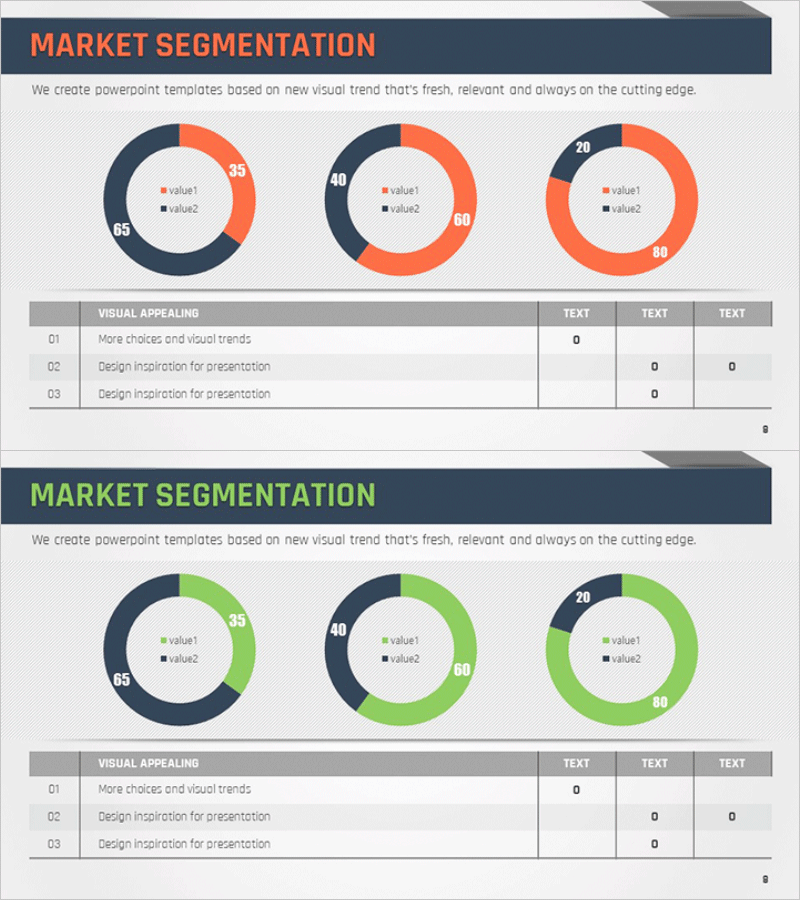
A professional donut chart PowerPoint slide designed for market segmentation and data ratio visualization. Features three donut charts in orange and navy color scheme, each displaying different two-value proportions (65:35, 40:60, 20:80) to compare market segments, customer distribution, or product sales breakdown. Below each chart is an integrated table area for presenting supporting data and analysis details. The slide layout supports business presentations, quarterly reports, marketing strategy documents, and investor pitch decks where comparative ratio analysis is essential. Delivered in 16:9 widescreen format with 2 fully editable slides ready for immediate customization.
Usage Points
-
Main Usage
Visualize two-value ratio data such as market share, customer demographics, product sales breakdown, and segment comparison. The hollow center of each donut allows emphasis of key metrics or percentages, while multiple charts arranged side-by-side enable time-series, regional, or segment-based comparative analysis with clear visual hierarchy.
-
How to Use
Double-click each donut chart value to input your data; proportions update automatically. Modify colors via the theme color palette to match your brand. Complete the table section with analysis insights, explanations, and data sources to enhance credibility. Duplicate the slide layout to add additional comparison datasets as needed.
-
Recommended For
Marketing managers, executives, management consultants, research analysts, and sales directors presenting market conditions, competitive analysis, customer segmentation, and sales performance. Ideal for business plans, quarterly performance reports, marketing strategy documents, and investor presentations.
-
Slide Structure
Slide 1: Title area + 3 donut charts (each with 2-value data series) + legend + table (3 rows × 4 columns). Slide 2: Identical layout for additional data sets. Donut centers support numeric labels; table rows and columns are fully editable for custom data entry.
Related Products
-

Industry Trend Analysis Donut Chart – Visual Trends Presentation
#Market and Competitor Analysis #Diagram #Graph
-

Detailed Analysis in Book Illustration PowerPoint Template
#Market and Competitor Analysis #Diagram #Graph
-

Performance Analysis with Donut Chart and Table
#Market and Competitor Analysis #Diagram #Graph
-

Liquor Sales Chart – Market Analysis and Performance Management
#Market and Competitor Analysis #Financial Plans and Performance #Diagram
