Key Competitive Factors in Market Analysis – First Step Toward Competitive Advantage
RB0100031_5
- Last Update 03/03/2025
- File Size 3MB
- # of Slides 2
- File Format PPTX
- Slide Ratio 4:3
- Color
Keywords
- #Content-Based Slides
- #Design-Based Slides
- #Market and Competitor Analysis
- #Diagram
- #Graph
- #Market Analysis
- #Competitive Advantage
- #Table
- #Circles
- #Standard Table
- #Doughnut Chart
- #4:3
- #donut chart PowerPoint slide
- #donut graph template
- #3-segment pie chart
- #competitive analysis diagram
- #market analysis PPT template
About the Product
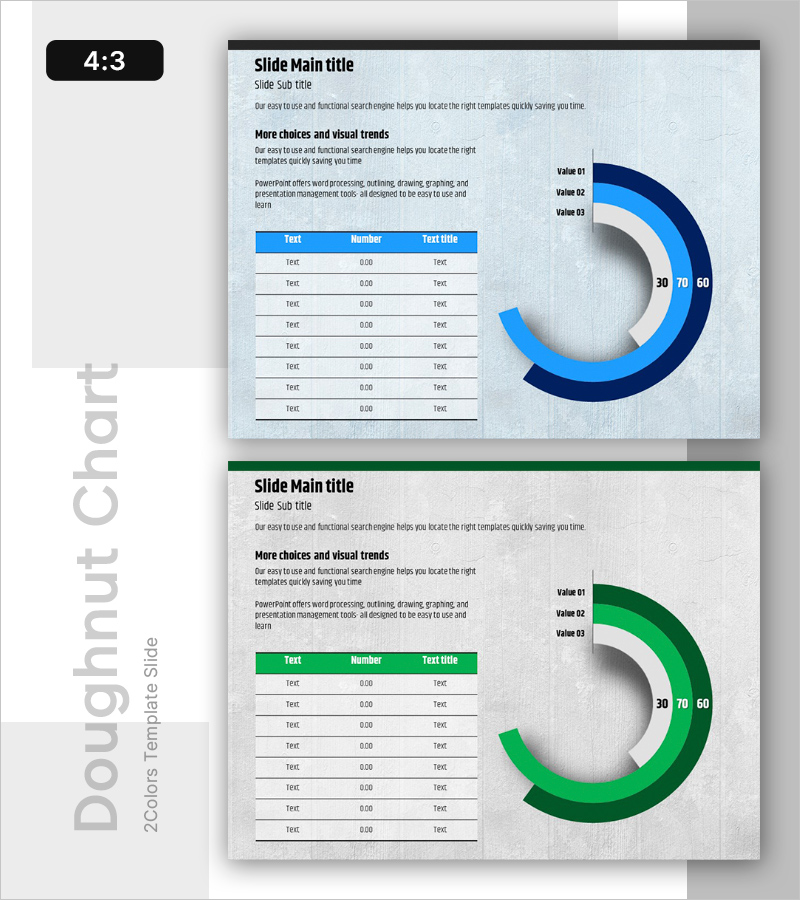
A donut chart PowerPoint slide designed for market analysis and competitive advantage strategy presentations. This template visualizes the proportional relationships between competitive factors using a concentric ring structure with three data series. The gradient treatment in light blue, dark blue, and white tones clearly differentiates data layers, while central numeric indicators (30, 70, 60) enhance quantitative information delivery. The 2-slide set offers both blue and green color schemes, allowing you to match your corporate brand identity. Includes editable text areas and data input fields for immediate customization and deployment.
Usage Points
-
Main Usage
Visualizes the proportional relationships of competitive factors during market analysis phases and emphasizes key elements when developing competitive advantage strategies. The donut structure's central space allows for additional text or logo insertion, increasing information density.
-
How to Use
Use in the market analysis or competitive analysis section of presentation materials. Input competitive factor names (price, quality, technology, etc.) and corresponding values into each segment, then add legend and descriptive text as needed. Choose between two color options to maintain design consistency with your presentation context.
-
Recommended For
Recommended for strategy planning teams, marketing departments, and executive reporting. Ideal for business plans, marketing strategy documents, and investor pitch decks when analyzing competitive landscapes—enhancing data credibility. Also suitable for consulting reports and market research presentations.
-
Slide Structure
2-slide set, each containing one donut chart. First slide features blue color scheme (dark blue, light blue, white) for 3-segment data representation; second slide uses green scheme. Each slide has title, subtitle, and descriptive text input areas on the left, with a data entry table format on the right for easy customization.
Related Products
-

Drug Addiction Risk Analysis Graph Chart – Insightful Information Delivery
#Market and Competitor Analysis #Diagram #Graph
-

Type Comparison Analysis Graph & Table – Effective Tool for Market Analysis
#Market and Competitor Analysis #Diagram #Graph
-

Business Note Analysis Circle Graph & Table – Market and Competitive Analysis
#Market and Competitor Analysis #Diagram #Graph
-

Shareholder Status Survey Donut Graph – Optimized for Market Analysis
#Company Introduction #Market and Competitor Analysis #Diagram
