Optimizing Competitor Analysis with Horizontal Bar Graph – Visual Impact
RJ0500031_19
- Last Update 06/15/2025
- File Size 1.7MB
- # of Slides 2
- File Format PPTX
- Slide Ratio 16:9
- Color
Keywords
- #Content-Based Slides
- #Design-Based Slides
- #Market and Competitor Analysis
- #Graph
- #Competitor Analysis
- #Competitive Advantage
- #Horizontal Bar
- #Horizontal Bar Chart
- #16:9
- #horizontal bar graph PowerPoint
- #competitor analysis presentation
- #bar chart slide template
- #comparison analysis PPT
- #graph PowerPoint slide design
About the Product
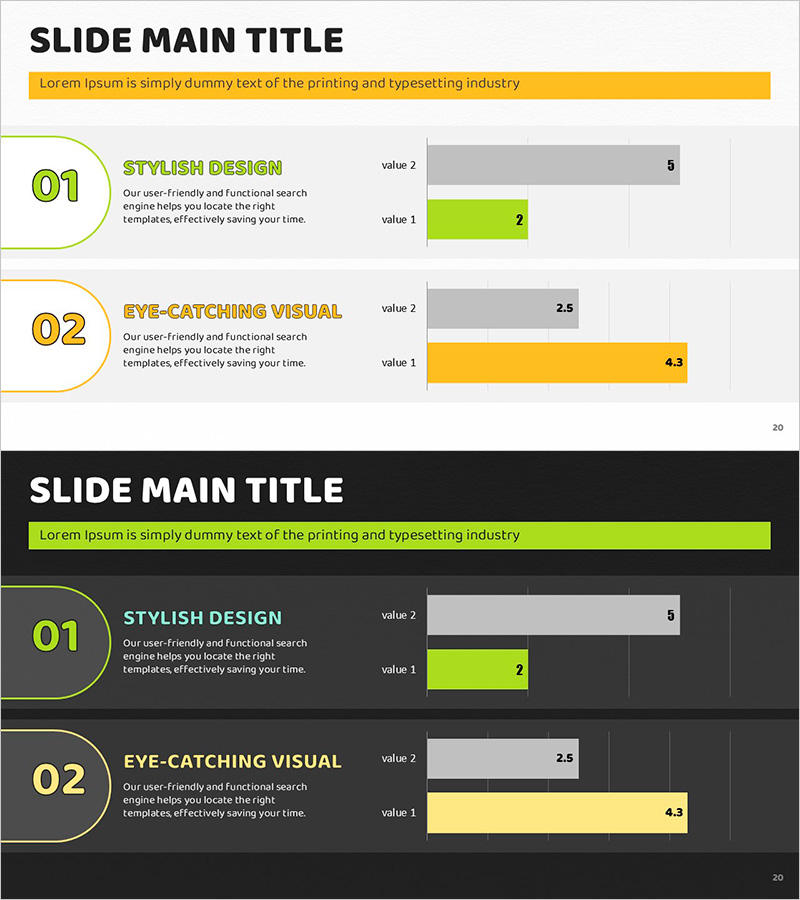
A horizontal bar graph PowerPoint slide optimized for competitor analysis presentations. The design uses lime green and orange dual-tone colors to clearly compare two metrics side by side, with numerical labels displayed on each bar for enhanced data readability. This 16:9 widescreen 2-slide template integrates seamlessly into your presentation deck and works perfectly for visualizing market share, revenue figures, customer satisfaction scores, and other competitive benchmarks. The contrasting color scheme and clean layout make competitive advantages stand out during executive briefings, client pitches, and strategic planning sessions.
Usage Points
-
Main Usage
Visualize side-by-side comparison of two companies or products across key performance indicators such as revenue, market share, customer satisfaction, or technical capabilities. The bar length and numerical labels enable audiences to instantly grasp competitive differences and strategic positioning.
-
How to Use
Open the slide and replace the placeholder text and values with your own data. Assign the lime green bar to your company or primary competitor and the orange bar to the comparison target. Input your metrics and the bar lengths adjust automatically. Colors and fonts can be customized to match your corporate branding guidelines.
-
Recommended For
Strategy teams, marketing departments, and sales professionals preparing competitive analysis reports, business proposals, and investor presentations. Ideal for market entry strategy, product positioning, pricing justification, and competitive landscape sections. Suitable for executive briefings, client presentations, and internal strategy meetings.
-
Slide Structure
2-slide layout with title area, descriptive text section, and horizontal bar graph visualization. Each slide displays two metrics (value 1 and value 2) side by side in lime green and orange bars respectively. Numerical labels appear at the end of each bar for precise data comparison and quick reference.
Related Products
-

Red Blue Area Chart – Market and Competitor Analysis
#Market and Competitor Analysis #Graph #Competitor Analysis
-

Navy Orange Comparison Bar Graph
#Market and Competitor Analysis #Graph #Competitor Analysis
-

Eco-friendly Eco Horizontal Bar Graph - Market Competition Analysis
#Market and Competitor Analysis #Graph #Competitor Analysis
-

Competitor Analysis and Differentiation Strategy Diagram
#Market and Competitor Analysis #Diagram #Graph
