Navy Orange Comparison Bar Graph
RM0100009_13
- Last Update 01/27/2025
- File Size 0.7MB
- # of Slides 2
- File Format PPTX
- Slide Ratio 16:9
- Color
Keywords
- #Content-Based Slides
- #Design-Based Slides
- #Market and Competitor Analysis
- #Graph
- #Competitor Analysis
- #Competitive Advantage
- #Horizontal Bar
- #Line
- #Horizontal Bar Chart
- #Line Chart
- #16:9
- #line bar chart PowerPoint
- #combination chart slide template
- #dual series comparison
- #trend analysis presentation
- #data visualization PPT download
About the Product
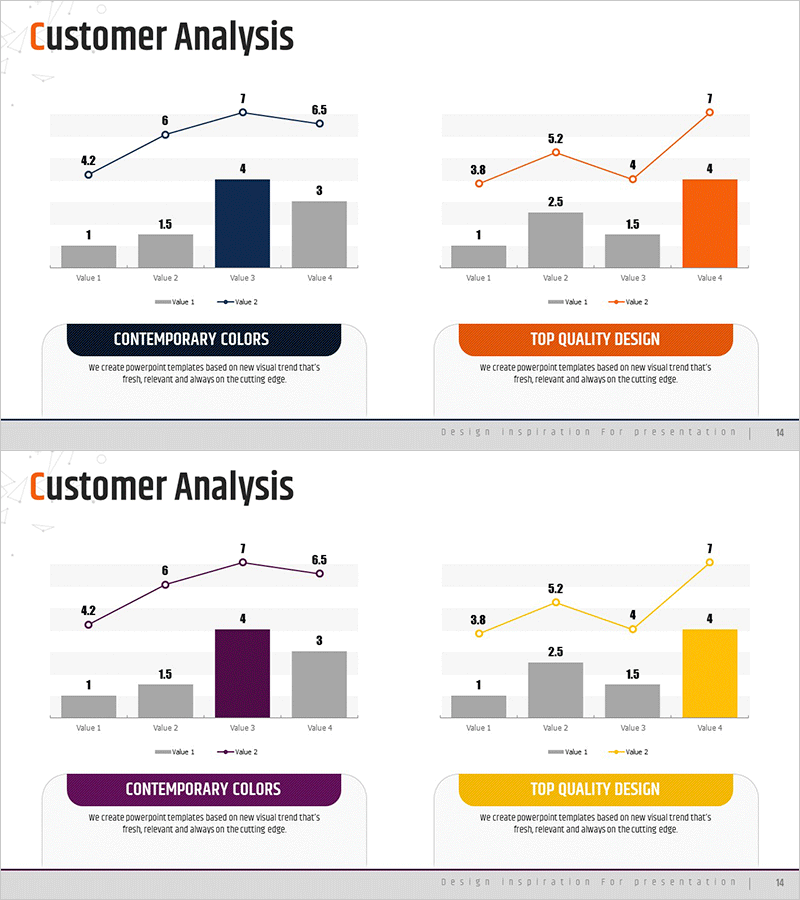
A 2-slide PowerPoint presentation set for visualizing customer analysis data with combined line and bar charts. The design uses navy-colored bars to represent one data series and orange line graphs to show trend changes, enabling simultaneous comparison of values and progression across four data points (Value 1–4). This dual-axis visualization effectively communicates complex datasets for market analysis, competitive benchmarking, and performance reporting. The slides are ready to customize with your own data for immediate use in business presentations.
Usage Points
-
Main Usage
Ideal for presentations requiring simultaneous display of multiple data series, such as customer analysis, market trends, and competitive comparisons. The combination of line and bar elements emphasizes both trend progression and absolute value comparison, enhancing audience comprehension.
-
How to Use
Replace the Value 1–4 items and corresponding numbers with your own data. Assign the navy bars as your baseline metric and the orange line as your comparison metric to clearly illustrate the relationship between two key performance indicators.
-
Recommended For
Marketing professionals, sales analysts, business executives, management consultants, and data analysts preparing quarterly reports, customer satisfaction trends, market share evolution, and competitive positioning analyses.
-
Slide Structure
Two-slide set, each featuring four data points with navy bars (Value 1) and orange line graphs (Value 2). Section headers 'Contemporary Colors' or 'Top Quality Design' appear at the top. Formatted in 16:9 widescreen for modern presentation environments and full compatibility with standard PowerPoint displays.
Related Products
-

Competitor Comparison Line Graph
#Market and Competitor Analysis #Graph #Competitor Analysis
-

Agricultural Competitor Analysis Horizontal Bar Chart
#Market and Competitor Analysis #Graph #Competitor Analysis
-

Business Competitor Trend Graph – A Tool for Analyzing Competitive Advantage through Market Analysis
#Market and Competitor Analysis #Graph #Competitor Analysis
-

Business Plan Presentation Template – Line Diagram for Market Analysis
#Market and Competitor Analysis #Graph #Competitor Analysis
