Industry-leading Key Performance Analysis Charts
RM0300013_17
- Last Update 02/10/2025
- File Size 1.7MB
- # of Slides 2
- File Format PPTX
- Slide Ratio 16:9
- Color
Keywords
- #Content-Based Slides
- #Design-Based Slides
- #Company Introduction
- #Market and Competitor Analysis
- #Diagram
- #Graph
- #Key Achievements
- #Market Analysis
- #Table
- #Horizontal Bar
- #Segmented Horizontal Bar
- #16:9
- #horizontal bar chart PowerPoint
- #vertical bar chart slide template
- #performance analysis charts
- #4-series data visualization
- #bar graph PowerPoint slide download
About the Product
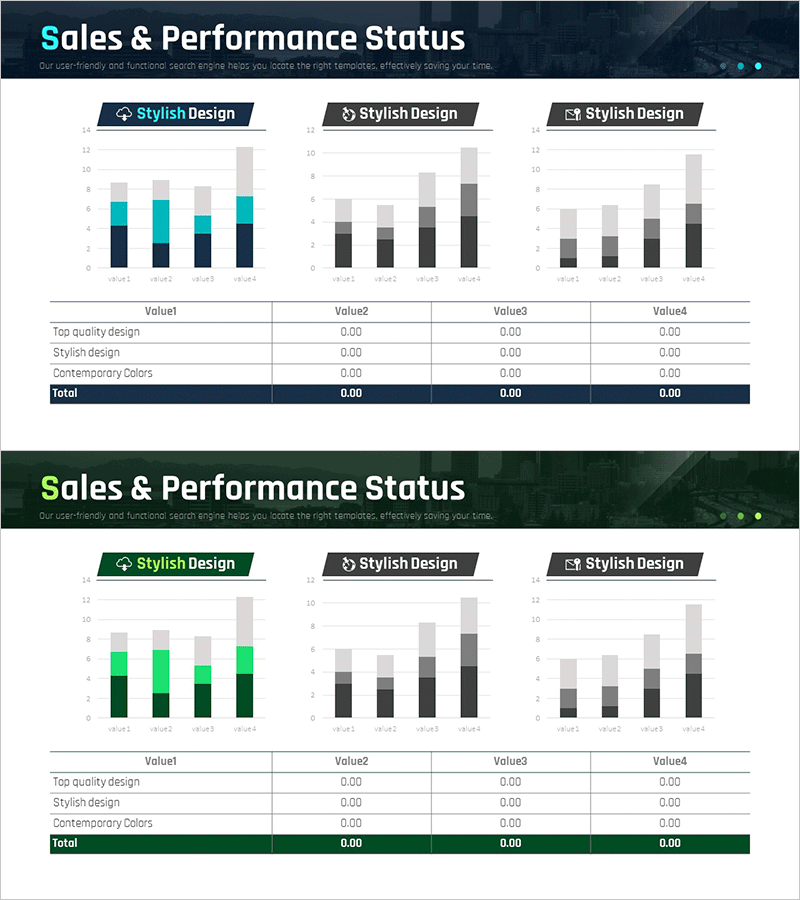
A 2-slide PowerPoint presentation designed for industry performance analysis and data comparison. This template includes both horizontal and vertical bar chart layouts, each displaying 4 data series in a cohesive color scheme of dark blue, light blue, gray, and light gray tones. The slides are ideal for presenting key performance indicators, market analysis data, competitive benchmarking, and sales metrics in business presentations and reports. Both chart types are fully editable and ready to customize with your own data.
Usage Points
-
Main Usage
Display multi-series data comparisons such as quarterly sales performance, market share analysis, competitive positioning, and KPI tracking. Horizontal bars excel when category names are lengthy, while vertical bars are optimized for time-series trend visualization.
-
How to Use
Insert into market analysis sections of business plans, quarterly performance reports, investor pitch decks, and strategic planning presentations. The color-coded bars and legend system enable clear differentiation of 4 data series, making numerical comparisons immediately apparent to audiences.
-
Recommended For
Executive presentations, marketing team performance reviews, sales pipeline analysis, financial reporting, management consulting, business intelligence teams, and any role requiring data-driven decision-making and stakeholder communication.
-
Slide Structure
Slide 1: Horizontal bar chart with 4 items × 4 data series. Slide 2: Vertical bar chart with 4 time periods × 4 data series. Both slides include title area, legend, and gridlines optimized for 16:9 widescreen format.
Related Products
-

Shareholder Status Analysis Data Chart – Insights and Market Analysis
#Company Introduction #Market and Competitor Analysis #Diagram
-

Segmented Horizontal Bar Charts and Tables – Optimal Data Visualization for Market Analysis
#Market and Competitor Analysis #Diagram #Graph
-

Performance Analysis 3D Bar Chart & Table – Market and Performance Analysis
#Company Introduction #Market and Competitor Analysis #Diagram
-

Performance Comparison Analysis Graph – Data-Driven Visualization
#Company Introduction #Market and Competitor Analysis #Diagram
