Comparative Vertical Graphs by Region – Effective Market Analysis
RJ0300020_6
- Last Update 04/23/2025
- File Size 1.2MB
- # of Slides 2
- File Format PPTX
- Slide Ratio 16:9
- Color
Keywords
About the Product
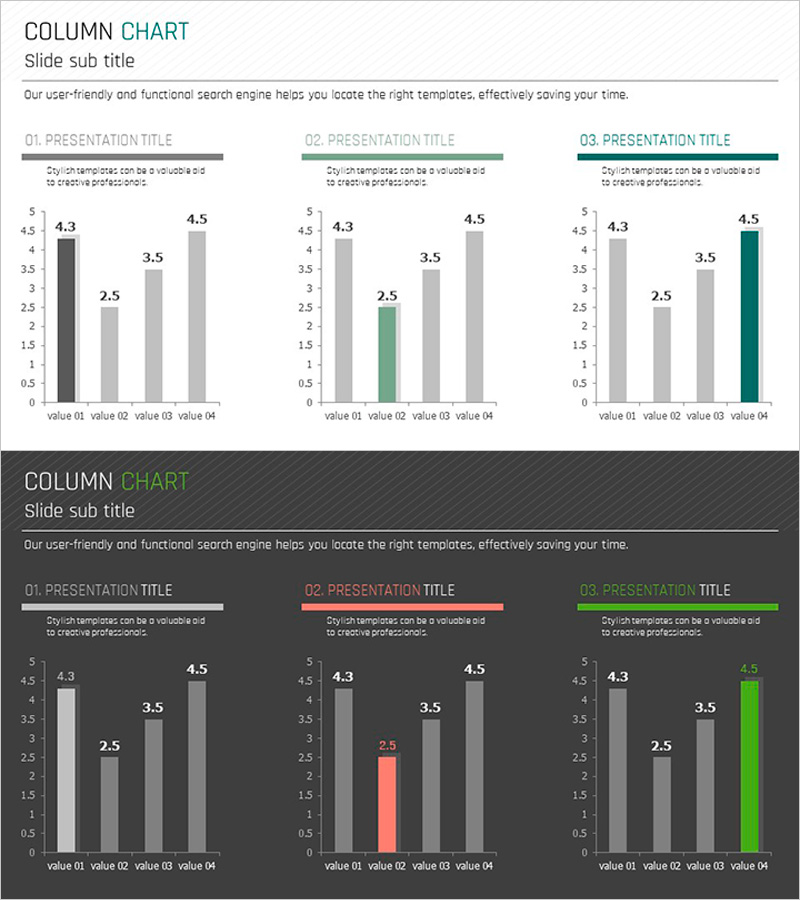
A PowerPoint slide featuring a vertical bar chart comparing numerical data across four items. Two background versions are provided—light and dark—each with three color accent options (gray, green, and teal) to highlight specific data points. Ideal for market analysis, competitive benchmarking, sales performance comparison, and quantitative data visualization in business presentations. Delivered in 16:9 widescreen PPTX format with fully editable values, labels, and legends for seamless customization.
Usage Points
-
Main Usage
Effectively visualizes quantitative data comparisons across four distinct items, highlighting numerical differences at a glance. Perfect for market size comparison, sales volume trends, competitive performance analysis, and regional performance metrics where simultaneous comparison of multiple data points is essential.
-
How to Use
Enter your analysis topic in the title area and replace the default values with your actual data. Use the light background for bright presentation venues and the dark background for dimly lit environments. Apply color accent options to emphasize specific items and draw audience attention to key findings.
-
Recommended For
Marketing managers, sales directors, financial analysts, and business executives presenting market conditions, sales results, and budget comparisons. Suitable for quarterly performance reviews, competitive analysis reports, investor presentations, and strategic planning meetings.
-
Slide Structure
Each slide contains a title section, descriptive text area, and a vertical bar chart with four data items. Bars are scaled against a 0–5 numerical axis with item labels positioned below. All values, legends, and data labels are fully editable text elements for flexible customization.
Related Products
-

Market Analysis Vertical Bar Graph – Visualizing Data
#Market and Competitor Analysis #Graph #Market Analysis
-

Comparative Analysis of Eco-Friendly Categories Slide – Market Competitive Advantage
#Market and Competitor Analysis #Financial Plans and Performance #Diagram
-

Modern Business Plan Template – Clustered Column Graph
#Market and Competitor Analysis #Graph #Market Analysis
-

Survey Graph on the Background of the Sea – Market Analysis & Competitive Edge
#Market and Competitor Analysis #Diagram #Graph
