Survey Graph on the Background of the Sea – Market Analysis & Competitive Edge
RJ0500046_26
- Last Update 06/20/2025
- File Size 0.3MB
- # of Slides 2
- File Format PPTX
- Slide Ratio 16:9
- Color
Keywords
- #Content-Based Slides
- #Design-Based Slides
- #Market and Competitor Analysis
- #Diagram
- #Graph
- #Market Analysis
- #Competitive Advantage
- #Cluster
- #Column
- #Closed Cluster Diagram
- #Column Chart
- #16:9
- #vertical bar chart PowerPoint
- #bar graph presentation slide
- #survey results chart
- #market analysis graph
- #3-item comparison slide
- #data visualization PowerPoint template
About the Product
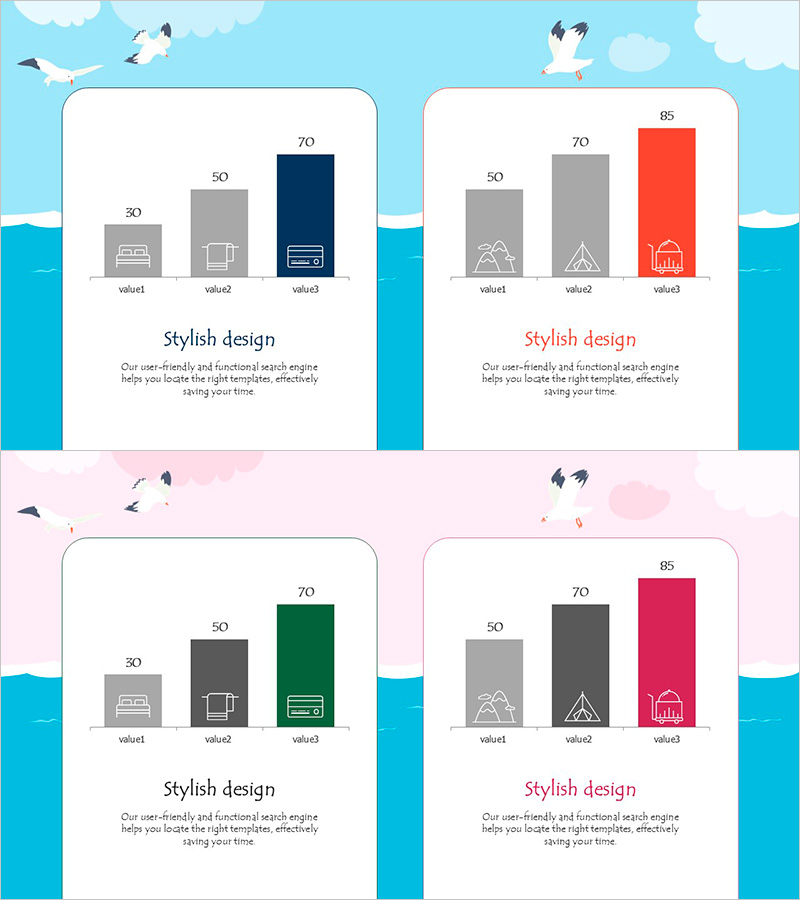
A vertical bar chart PowerPoint slide featuring a serene sea background with light sky blue tones. This presentation slide compares three items with values of 30, 50, and 70, accompanied by icons for intuitive data visualization. The 2-slide set offers color variations: the left slide uses navy, gray, and gray tones, while the right slide features gray, gray, and red tones to suit different presentation contexts. In 16:9 widescreen PPTX format, this slide is ready for immediate editing and ideal for survey results, market analysis, competitive positioning, customer satisfaction studies, and market share comparisons in business presentations.
Usage Points
-
Main Usage
Visually compare three data points such as survey results, market analysis, competitor benchmarking, or customer satisfaction metrics using vertical bar charts. The serene sea background adds credibility and stability to your presentation, while icons clarify the meaning of each data category.
-
How to Use
Insert this slide into business presentations, marketing plans, or performance reports in the data analysis section. Choose the navy-toned version to emphasize corporate image or the red-toned version to highlight achievements. Simply replace the values and labels with your own data for immediate use in your presentation.
-
Recommended For
Marketing professionals, business analysts, sales executives, consultants, and project managers presenting survey findings, customer feedback, competitive analysis, or sales performance comparisons. Ideal for any business presentation requiring three-item numerical comparison.
-
Slide Structure
2-slide set, each containing three vertical bar charts. Left slide uses navy, gray, and gray color scheme; right slide features gray, gray, and red tones. Each bar displays values (30, 50, 70) with labels above. Bottom section includes 'value1, value2, value3' text labels and description area.
Related Products
-

Column Chart for Comparative Analysis – Market and Competitive Advantage
#Market and Competitor Analysis #Graph #Market Analysis
-

Market Analysis Vertical Bar Graph – Visualizing Data
#Market and Competitor Analysis #Graph #Market Analysis
-

Comparative Analysis of Eco-Friendly Categories Slide – Market Competitive Advantage
#Market and Competitor Analysis #Financial Plans and Performance #Diagram
-

Comparative Vertical Graphs by Region – Effective Market Analysis
#Market and Competitor Analysis #Graph #Market Analysis
