Pie Chart and Table Metrics – Market Share Analysis
RB0800068_4
- Last Update 03/27/2025
- File Size 0.7MB
- # of Slides 2
- File Format PPTX
- Slide Ratio 4:3
- Color
Keywords
- #Content-Based Slides
- #Design-Based Slides
- #Market and Competitor Analysis
- #Financial Plans and Performance
- #Diagram
- #Graph
- #Market Share
- #Sales and Revenue
- #Table
- #Circles
- #Standard Table
- #Pie Chart
- #4:3
- #pie chart PowerPoint slide
- #market share analysis template
- #financial metrics presentation
- #data visualization slides
- #pie graph download
About the Product
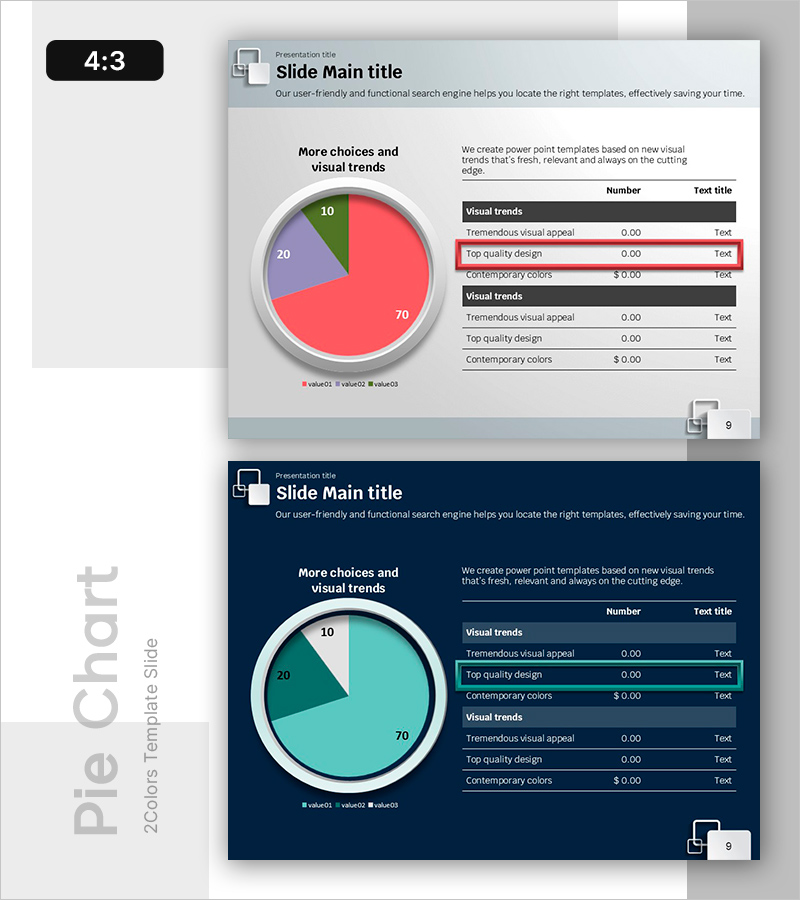
A professional PowerPoint slide set designed for market share analysis and financial performance comparison. Features a three-segment pie chart (70%, 20%, 10% distribution) paired with a visual metrics table for intuitive data representation. The light gray background combines coral, purple, and green color segments, making it ideal for executive reports, investor presentations, and marketing analysis decks. Fully editable in 4:3 aspect ratio across 2 slides in PPTX format.
Usage Points
-
Main Usage
Compare and analyze three or more categories by proportion, such as market share, revenue composition, or customer distribution. The pie chart segments immediately show each category's share of the total, while the accompanying table provides specific numerical values and additional metrics.
-
How to Use
Insert into the market analysis section of executive reports, use as a business overview slide in investor presentations (IR), or include in the competitive analysis page of marketing plans. Simply replace the chart data and table figures with your actual statistics for immediate presentation use.
-
Recommended For
Finance and operations managers, marketing strategists, business development professionals, and investor relations teams presenting quantitative data-driven insights. Ideal for quarterly performance reviews, new business proposals, and client situation analysis presentations.
-
Slide Structure
Slide 1: Left side displays a 3-segment pie chart (coral 70%, purple 20%, green 10%); right side shows a 'Visual trends' table (3 rows × 3 columns). Slide 2: Identical layout with dark navy background and cyan-toned pie chart. 4:3 aspect ratio, 2-slide set.
Related Products
-

Square Frame Presentation Template – Pie Chart & Table
#Market and Competitor Analysis #Financial Plans and Performance #Diagram
-

Visualizing Market Analysis with Table and 3D Pie Chart
#Market and Competitor Analysis #Financial Plans and Performance #Diagram
-

ABSTRACT PATTERN Presentation PIE CHART – Clearly Visualize Market Share
#Market and Competitor Analysis #Financial Plans and Performance #Diagram
-

Red-Blue Stereoscopic Pie Charts – Performance Visualization
#Company Introduction #Market and Competitor Analysis #Diagram
