Square Frame Presentation Template – Pie Chart & Table
RJ0200010_11
- Last Update 03/31/2025
- File Size 0.5MB
- # of Slides 2
- File Format PPTX
- Slide Ratio 16:9
- Color
Keywords
- #Content-Based Slides
- #Design-Based Slides
- #Market and Competitor Analysis
- #Financial Plans and Performance
- #Diagram
- #Graph
- #Market Share
- #Sales and Revenue
- #Table
- #Circles
- #Standard Table
- #Pie Chart
- #16:9
- #pie chart PowerPoint slide
- #pie graph template
- #data visualization slides
- #ratio comparison PPT
- #table and chart template
- #financial analysis presentation
- #market share diagram
About the Product
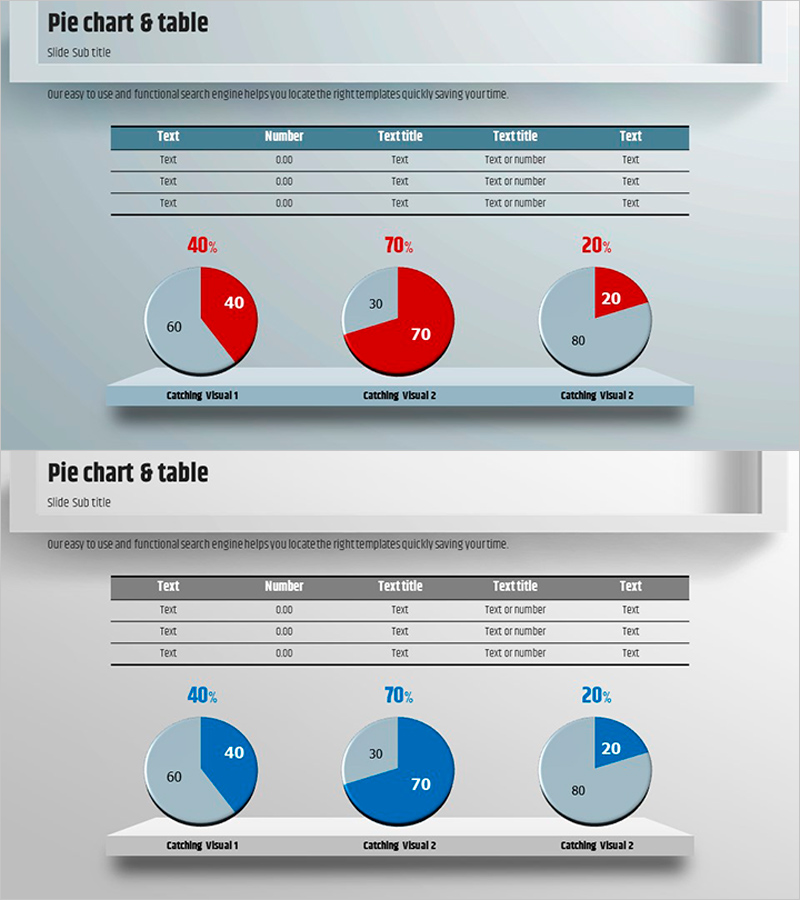
A professional PowerPoint slide designed for market analysis and financial planning presentations. This template combines a 5-column data table at the top with three pie charts below, enabling simultaneous display of numerical information and percentage distribution. Available in two color schemes—red and blue—each pie chart displays different ratios such as 40%, 70%, and 20%. Perfect for presenting composition ratios, market share, budget allocation, and comparative data in business reports, proposals, and executive presentations. The 2-slide PPTX format is fully editable and ready to customize with your own data.
Usage Points
-
Main Usage
Display and compare numerical data ratios and composition at a glance. This slide arranges three pie charts side-by-side to visualize multiple items' proportions simultaneously, while the data table above provides precise figures. Ideal for presenting market share, budget distribution, customer composition, and sales breakdown.
-
How to Use
Replace the table headers and data cells with your actual information. Edit the pie chart values and labels to match your dataset. Choose between the red or blue color version to align with your corporate branding. Use the 'Catching Visual' labels below each chart to identify data categories and enhance audience comprehension during presentation.
-
Recommended For
Finance team reports, marketing analysis presentations, quarterly performance reviews, investor pitch decks, business plan market analysis sections, and executive briefings. Recommended for data-driven decision-making meetings, shareholder reports, and client presentations where numerical credibility is essential.
-
Slide Structure
Two layout variations per slide: (1) 5-column data table positioned above three pie charts in horizontal arrangement, (2) identical layout with color variation (red/blue scheme). Each pie chart supports 2-3 segment divisions representing various ratios from 40% to 70% to 20%. 16:9 widescreen format optimized for modern presentation environments.
Related Products
-

ABSTRACT PATTERN Presentation PIE CHART – Clearly Visualize Market Share
#Market and Competitor Analysis #Financial Plans and Performance #Diagram
-

Pie Chart and Table Metrics – Market Share Analysis
#Market and Competitor Analysis #Financial Plans and Performance #Diagram
-

Visualizing Market Analysis with Table and 3D Pie Chart
#Market and Competitor Analysis #Financial Plans and Performance #Diagram
-

Triangular Pattern Presentation Template Pie Chart – Market Analysis and Strategy
#Market and Competitor Analysis #Financial Plans and Performance #Diagram
