Travel Preference Survey Slide – Market Status and Competitive Advantage
RJ0600106_11
- Last Update 07/19/2025
- File Size 2.4MB
- # of Slides 2
- File Format PPTX
- Slide Ratio 16:9
- Color
Keywords
- #Content-Based Slides
- #Design-Based Slides
- #Market and Competitor Analysis
- #Graph
- #Market Status
- #Competitive Advantage
- #Line
- #Line Chart
- #16:9
- #line chart PowerPoint
- #dual-series trend comparison slide
- #time-series data visualization PPT
- #competitive analysis chart template
- #line graph presentation slide download
About the Product
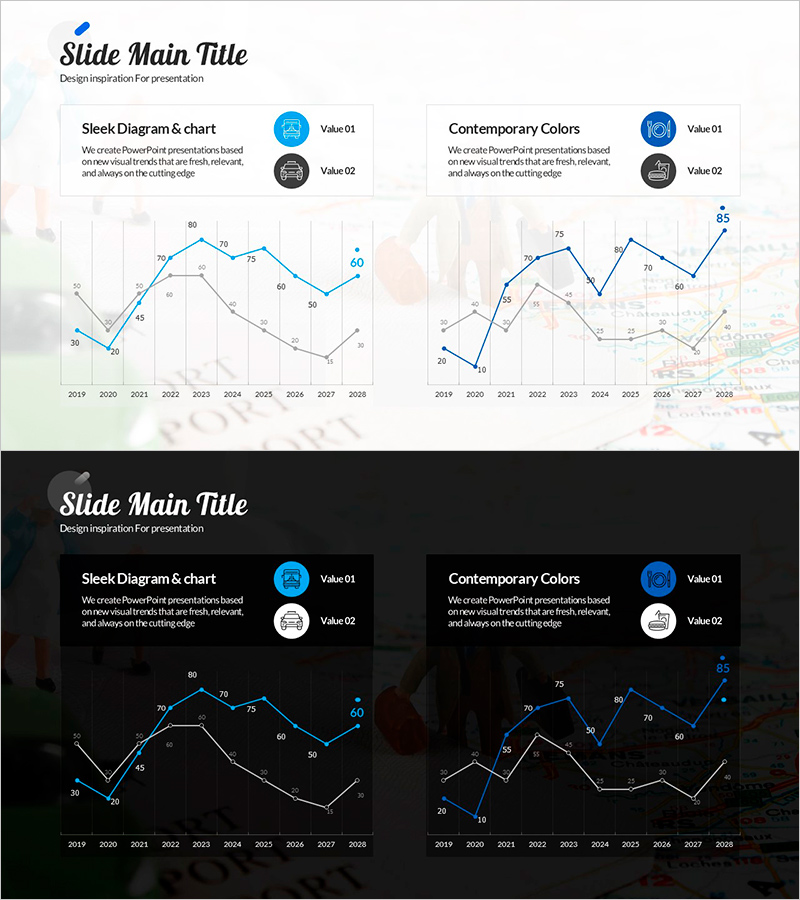
A dual-series line chart PowerPoint slide designed for travel market analysis and competitive advantage assessment. This presentation slide visualizes data trends from 2019 to 2028, comparing two key metrics side by side. The template includes both light and dark background versions to suit different presentation environments. The line chart features clear data points, numerical labels, and distinct color coding—blue line for primary metric, gray line for secondary metric. Each series is easy to read and interpret, making it ideal for executive presentations, market reports, and competitive analysis decks. Fully editable format allows you to input your own data and customize the chart instantly.
Usage Points
-
Main Usage
Visualize time-series data trends for travel market research, competitive benchmarking, and performance analysis. The dual-line structure enables side-by-side comparison of two metrics—such as your company versus competitors, or different market segments—across multiple years. Clearly shows growth patterns, fluctuations, and performance gaps.
-
How to Use
Insert into market analysis, competitive positioning, or performance review sections of your presentation. Use the light background version for standard conference rooms and seminars; deploy the dark background version for projector-based presentations and large-scale events. Replace chart data by copying values from Excel—the chart updates automatically while maintaining design consistency.
-
Recommended For
Travel and tourism marketing professionals, market research analysts, business intelligence teams, and executives preparing investor pitches or quarterly reports. Ideal for anyone presenting time-series comparisons, trend analysis, or competitive market positioning to stakeholders.
-
Slide Structure
Two-slide set. Slide 1 features a light background (white/light gray) with dual-series line chart: blue line and gray line representing two data series, X-axis spanning 2019–2028, Y-axis range 20–85, with labeled data points. Slide 2 mirrors the structure on a dark background (black/dark gray) for high-contrast visibility in projection environments.
Related Products
-

Line Graph for Camping Market Analysis – Market Trends and Competitive Advantage
#Market and Competitor Analysis #Graph #Market Status
-

Blue Green Basic Line Chart – Market Status and Competitive Analysis
#Market and Competitor Analysis #Graph #Market Status
-

Vegetable Market Status Analysis with Line Charts
#Market and Competitor Analysis #Graph #Market Status
-

Interior Template Line Chart – Market Trends and Competitive Advantage
#Market and Competitor Analysis #Graph #Market Status
