Comparison of Change Curves – Market and Competitor Analysis
RB0800012_12
- Last Update 03/19/2025
- File Size 3.8MB
- # of Slides 2
- File Format PPTX
- Slide Ratio 4:3
- Color
Keywords
- #Content-Based Slides
- #Design-Based Slides
- #Market and Competitor Analysis
- #Graph
- #Market Status
- #Competitive Advantage
- #Line
- #Line Chart
- #4:3
- #line chart PowerPoint
- #trend analysis slide
- #market comparison chart
- #dual-series line graph
- #competitive analysis PowerPoint
- #data visualization slide template
About the Product
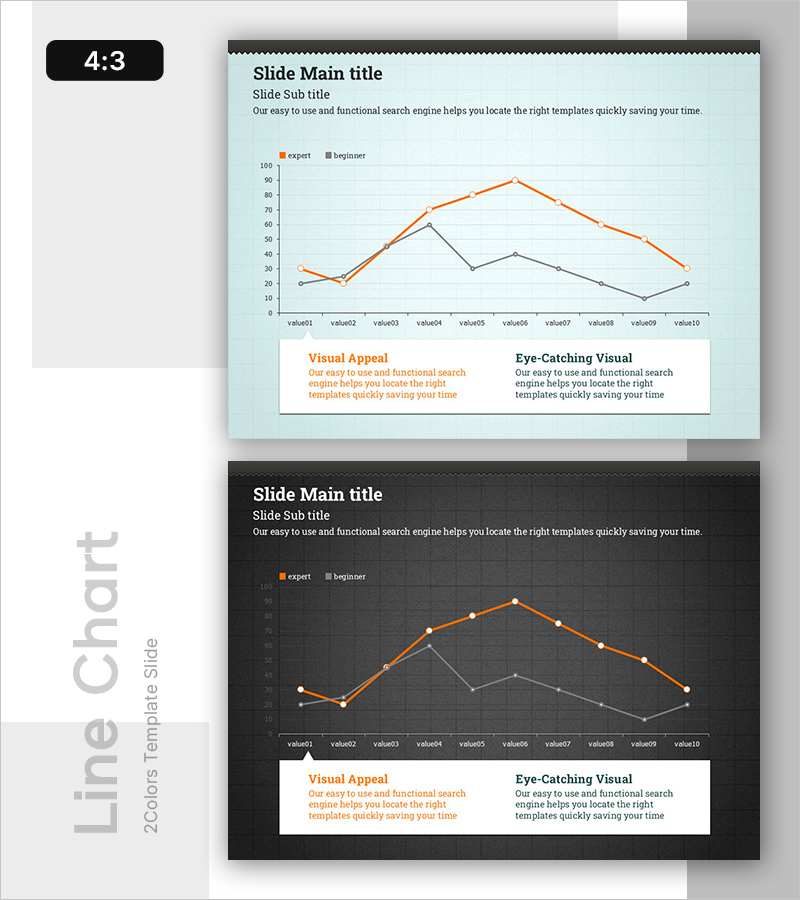
A professional line chart PowerPoint slide designed for market analysis and competitive benchmarking. Two data series in orange and gray lines track performance changes across 10 data points, enabling clear comparison of expert vs. beginner metrics or company vs. competitor trends. The slide features a light mint background with supporting text boxes labeled 'Visual Appeal' and 'Eye-Catching Visual' to highlight key insights. A dark background version is also included for flexible presentation environments. Fully editable PPTX format allows instant data updates with automatic chart recalculation.
Usage Points
-
Main Usage
Visualizes numerical changes over time using two comparable data series. Ideal for displaying market share evolution, revenue growth rates, customer satisfaction trends, and performance gaps between your organization and competitors in a single, intuitive view.
-
How to Use
Enter numerical values for value01 through value10 in the slide's data table, and the chart automatically updates. Customize the legend labels from 'expert' and 'beginner' to reflect your context—such as company vs. competitor, target vs. actual, or any other paired metrics.
-
Recommended For
Executive reports, quarterly and annual performance reviews, market analysis presentations, competitive positioning briefs, and strategic planning sessions. Suitable for marketing teams, sales departments, business planning units, and consulting firms presenting data-driven insights.
-
Slide Structure
Two-slide set: Slide 1 features a light mint background with dual-series line chart (10 data points), Slide 2 presents the same chart on a dark background. Both slides include two text boxes at the bottom—left box in orange accent, right box in dark text—for annotating analysis points. 4:3 aspect ratio, PPTX format.
Related Products
-

Blue Green Basic Line Chart – Market Status and Competitive Analysis
#Market and Competitor Analysis #Graph #Market Status
-

Vegetable Market Status Analysis with Line Charts
#Market and Competitor Analysis #Graph #Market Status
-

Line Graph for Camping Market Analysis – Market Trends and Competitive Advantage
#Market and Competitor Analysis #Graph #Market Status
-

Visualizing Use of Transportation for Overseas Travel – Market Status Analysis
#Market and Competitor Analysis #Graph #Market Status
