Circular Graph by Instrument – Performance and Strategy
RJ0500020_31
- Last Update 06/12/2025
- File Size 0.7MB
- # of Slides 2
- File Format PPTX
- Slide Ratio 16:9
- Color
Keywords
About the Product
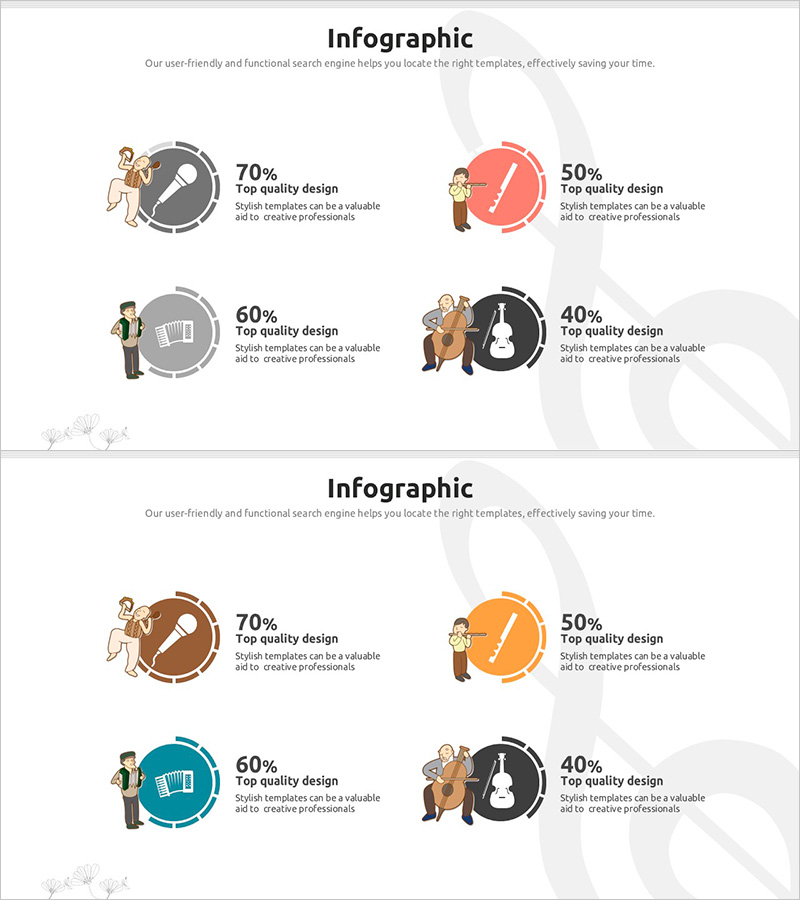
A PowerPoint slide that visualizes business performance and strategy using circular graphs organized by instrument categories. The 2-slide set features four color-coded pie charts in gray, red, orange, and black to clearly display percentage ratios for each item. The left side includes illustrations with percentage values, while the right side provides text areas for detailed explanations and insights. This PPT slide is ready to use immediately for performance analysis presentations, business strategy discussions, investor pitches, and quarterly reviews.
Usage Points
-
Main Usage
Clearly visualize the ratio and contribution of each performance metric using pie charts during business performance analysis and strategy planning. Effectively communicate data-driven performance status and future strategic direction to investors, employees, and business partners.
-
How to Use
Input actual data into the pie charts on the left side of the slide and write performance analysis content and strategic insights in the text area on the right. Modify the color scheme to match your company's brand colors or replace illustrations to reflect industry-specific characteristics.
-
Recommended For
Ideal for performance analysis sections in business plans, investor pitch decks, quarterly and annual performance reports, executive briefings, and strategy planning meetings. Commonly used by executives, planning teams, and marketing departments in finance, manufacturing, distribution, and service industries.
-
Slide Structure
The 2-slide set features four pie charts with text input areas on each slide. The left side displays illustrations and percentage values with four color-coded circular graphs, while the right side provides dedicated text areas for item-specific explanations, enabling simultaneous presentation of data and interpretation.
Related Products
-

Game Service Operation and Product Sales Performance – Data Visualization
#Company Introduction #Business Strategy #Graph
-

Performance and Future Prospects Green Navy – Business Strategy through Data Visualization
#Company Introduction #Business Strategy #Graph
-

Business Data Overview Slide - Performance Visualization
#Company Introduction #Business Strategy #Graph
-

Graph Slide Visualizing Performance and Future Prospects in Pink and Bluegreen
#Company Introduction #Business Strategy #Graph
