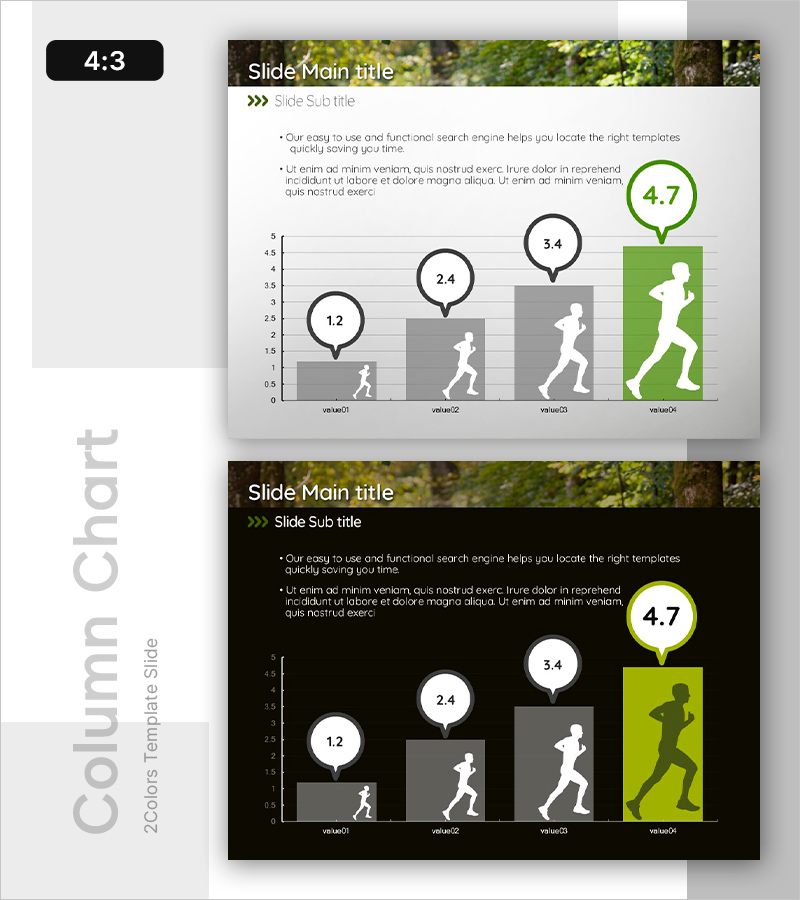
Exercise Ability Improvement Graph
RB0600007_5
- Last Update 03/14/2025
- File Size 0.8MB
- # of Slides 2
- File Format PPTX
- Slide Ratio 4:3
- Color
Keywords
- #Content-Based Slides
- #Design-Based Slides
- #Business Strategy
- #Market and Competitor Analysis
- #Graph
- #Text Box
- #Other
- #Achievements
- #Future Outlook
- #Column
- #Column Chart
- #Speech Bubble
- #Silhouette
- #4:3
- #exercise ability chart PowerPoint
- #column chart slide template
- #growth progression graph
- #performance metrics PPT
- #fitness improvement slide design
About the Product
A vertical column chart PowerPoint slide that visualizes the step-by-step improvement of exercise ability across four stages (1.2→2.4→3.4→4.7). The design combines gray and lime-green color coding with running silhouette icons at each stage to intuitively convey progress. Two slide layouts are included—one with a light background and one with a dark background—enabling immediate use in diverse presentation environments. Ideal for performance reports, improvement trends, and growth metrics presentations in fitness, sports science, and wellness programs.
Usage Points
-
Main Usage
Communicates step-by-step improvement in exercise ability, fitness levels, or performance metrics using both numerical values and visual elements. Bar height and silhouette size changes clearly show progression trends, while callout numbers emphasize precise measurements.
-
How to Use
Use in sports science, fitness program, and athletic assessment presentations to explain individual or group ability improvements. The light-background slide suits standard conference rooms, while the dark-background version works best for large-screen presentations. All numbers and labels are fully editable.
-
Recommended For
Sports scientists, fitness trainers, physical education instructors, performance managers, and wellness program coordinators presenting ability improvement results. Suitable for personal progress tracking, team performance analysis, and program effectiveness validation presentations.
-
Slide Structure
Four vertical columns (heights 1.2–4.7) with running silhouette icons showing posture progression at each stage, plus numeric callout bubbles (1.2, 2.4, 3.4, 4.7) above each bar. Two versions provided: light background with gray columns and lime-green accent, and dark background with matching color scheme.
Related Products
-

Market Trends and Analysis Charts – Delivering Business Insights
#Business Strategy #Market and Competitor Analysis #Graph
-

Performance Column Graph – Business Strategy and Competitor Analysis
#Business Strategy #Market and Competitor Analysis #Graph
-

Orange & Green Future Outlook Bar Graph
#Business Strategy #Market and Competitor Analysis #Graph
-

Graphs that draw a successful future outlook – Visualizing Market Trends
#Market and Competitor Analysis #Graph #Other
