Sports Vertical Bar Chart – The Perfect Choice for Performance Analysis
RJ0600052_11
- Last Update 07/04/2025
- File Size 0.5MB
- # of Slides 2
- File Format PPTX
- Slide Ratio 16:9
- Color
Keywords
- #Content-Based Slides
- #Design-Based Slides
- #Business Strategy
- #Market and Competitor Analysis
- #Graph
- #Other
- #Achievements
- #Competitive Advantage
- #Column
- #Column Chart
- #16:9
- #vertical bar chart PowerPoint
- #bar graph presentation slide
- #performance analysis chart
- #data comparison slide
- #how to create bar chart in PowerPoint
About the Product
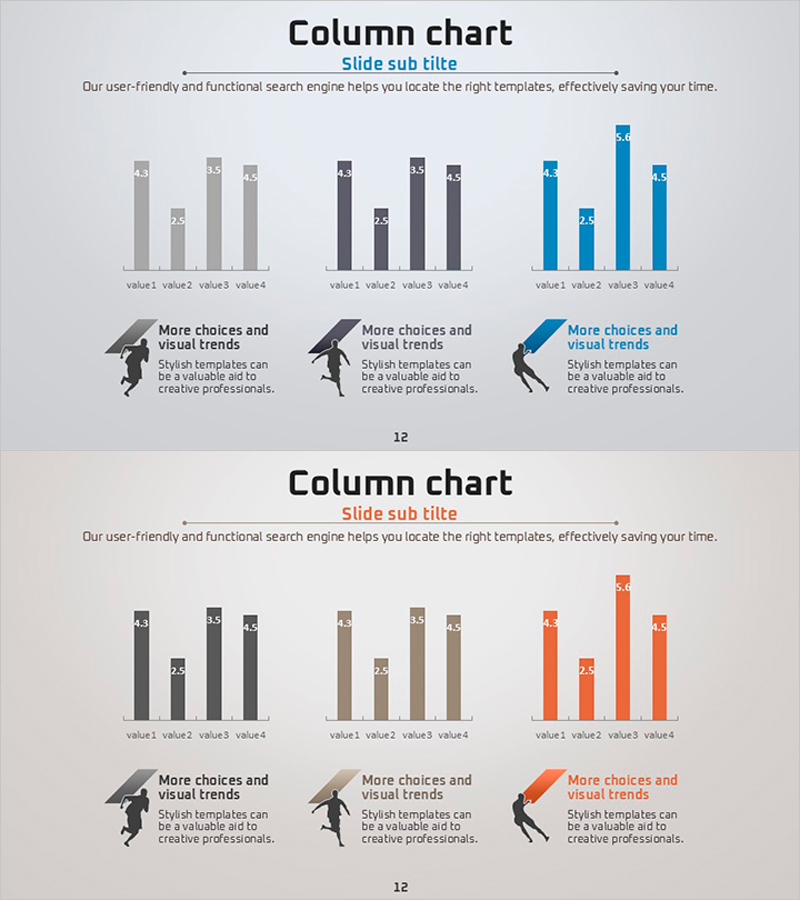
A vertical bar chart PowerPoint slide optimized for sports and business performance analysis. This presentation template features four-item comparison bars in three color schemes—gray, black, and blue—enabling intuitive numerical data visualization. Each slide includes clearly labeled data values above the bars, making it easy to interpret figures during presentations. Icon elements and descriptive text are strategically positioned to enhance information delivery. The 2-slide set is ready to use for performance metrics, market analysis, and business strategy presentations.
Usage Points
-
Main Usage
Visually compare and analyze performance metrics across four items using bar height and color differentiation. Ideal for displaying sports team performance indicators, sales results, marketing achievements, operational efficiency, and other quantitative data that requires clear comparative analysis.
-
How to Use
Insert into the performance analysis, market analysis, or business strategy sections of your presentation. Use bar heights and colors to emphasize differences between items, and supplement with icons and text descriptions for context. Edit data labels to input your actual figures and customize colors as needed.
-
Recommended For
Sports organization performance reports, sales and marketing team presentations, executive briefings, business plan pitches, quarterly and annual performance reviews. Suitable for any business presentation requiring quantitative data-driven decision-making and comparative analysis.
-
Slide Structure
2-slide set with vertical bar charts on each slide. Four items per chart displayed in three color variations (gray, black, blue). Numerical labels positioned above each bar for clarity. Left side features icons and 'More choices and visual trends' descriptive text, creating a clear information hierarchy.
Related Products
-

Bar Chart Visualizing Steak Consumption
#Business Strategy #Market and Competitor Analysis #Graph
-

Analysis of Climbing Success Rate with Doughnut Chart
#Business Strategy #Market and Competitor Analysis #Graph
-

Vertical Bar Chart Slide for Business Competitive Advantage Analysis
#Market and Competitor Analysis #Graph #Other
-

Visually Enhanced Bar Graph by Promotional Product Performance
#Business Strategy #Market and Competitor Analysis #Graph
