VR Sales Marketing Strategy PowerPoint Slide – Linear Flow Diagram
RJ0500044_15
- Last Update 06/19/2025
- File Size 2.5MB
- # of Slides 2
- File Format PPTX
- Slide Ratio 16:9
- Color
Keywords
- #Content-Based Slides
- #Design-Based Slides
- #Business Vision and Strategy
- #Marketing Plan and Strategy
- #Diagram
- #Business Strategy
- #Marketing Strategy
- #Flow
- #Linear Flow
- #16:9
- #linear flow diagram PowerPoint
- #3-step process presentation
- #marketing strategy slide template
- #arrow diagram PPT
- #business strategy PowerPoint
- #flowchart PowerPoint template download
About the Product
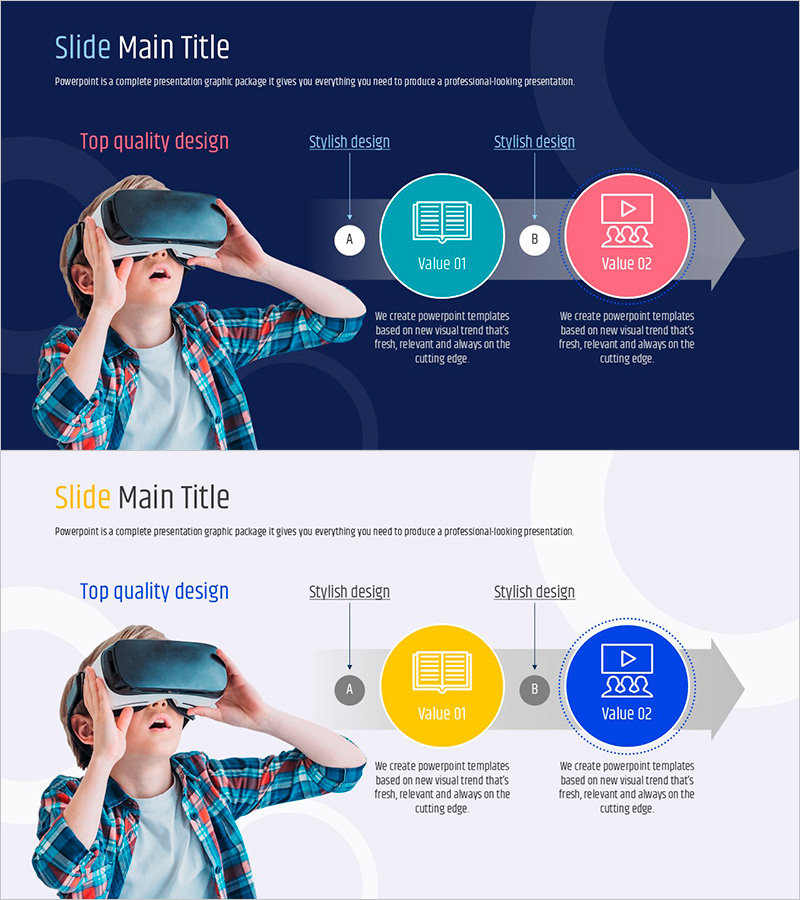
A PowerPoint slide presenting VR sales marketing strategy through a 3-step linear flow diagram. Features a dark navy background with turquoise and pink circular nodes connected by directional arrows to clearly visualize process stages. The layout combines a full-size VR headset image on the left with three sequential explanation areas on the right, making it immediately applicable for marketing strategy, business planning, and product launch presentations. Provided in 2-slide 16:9 PPTX format with fully editable text, colors, and node structure.
Usage Points
-
Main Usage
Explains marketing strategies, business plans, and product launch processes through sequential stages. The linear flow structure intuitively conveys step-by-step progression to audiences while reinforcing innovation in VR and technology-related presentations.
-
How to Use
Customize node text and description areas in the slide master to match your strategic stages. Modify the color palette or adjust arrow styles to align with brand guidelines. Replace the image area with alternative product photos to adapt the template for various marketing scenarios.
-
Recommended For
Ideal for marketing managers, business strategists, startup founders, and product managers presenting strategy pitches, investor relations, and internal meetings. Particularly effective for VR, AR, metaverse, and digital transformation project introductions.
-
Slide Structure
2-slide layout. Each slide features a full-size image on the left (person wearing VR headset) paired with 3 sequential stage nodes (A, B, C) on the right. Nodes are represented as turquoise, pink, and gray circles connected by directional arrows. Text fields below each node accommodate titles and descriptions for easy information customization.
Related Products
-

Infographic Slide Visualizing Step-by-Step Process
#Business Vision and Strategy #Marketing Plan and Strategy #Diagram
-

Sleek Diagrams and Charts – Optimal Design Strategies
#Business Vision and Strategy #Marketing Plan and Strategy #Diagram
-

Marketing Strategy Connection Diagram – Effective Business Vision Presentation
#Business Vision and Strategy #Marketing Plan and Strategy #Diagram
-

Sales Business Strategy by Furniture Segment – Designing the Future of Business
#Business Vision and Strategy #Marketing Plan and Strategy #Diagram
