Performer and Line Chart – Market Analysis and Future Outlook
RJ0500020_8
- Last Update 06/12/2025
- File Size 0.4MB
- # of Slides 2
- File Format PPTX
- Slide Ratio 16:9
- Color
Keywords
About the Product
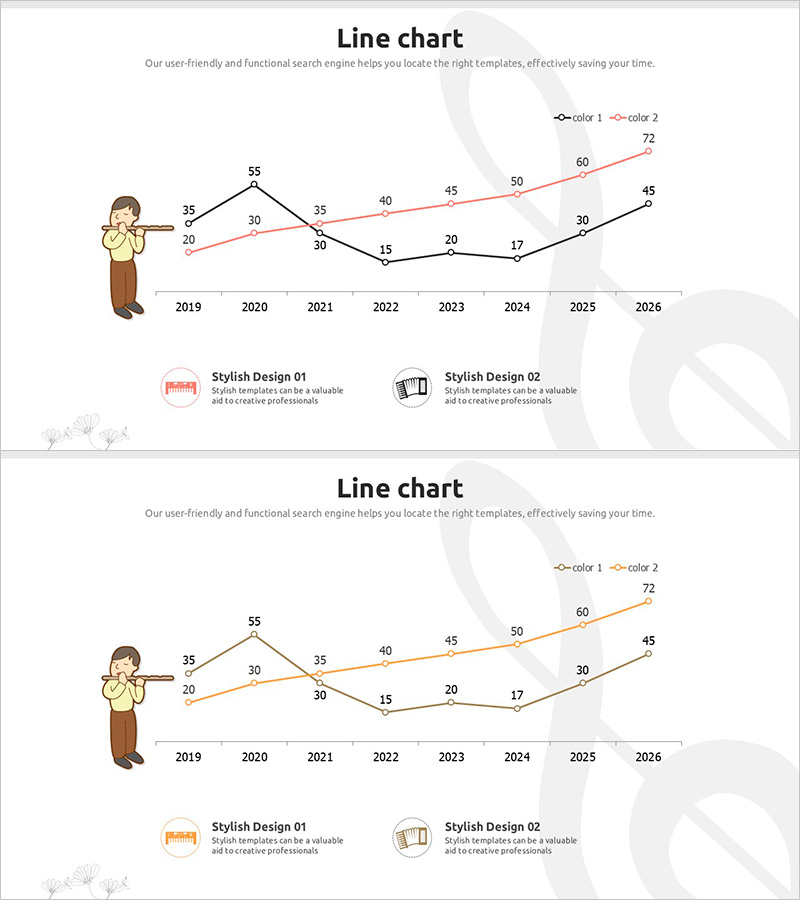
A PowerPoint slide featuring a dual-series line chart tracking market data from 2019 to 2026. Black and red lines create visual contrast, clearly showing upward and downward trends across eight years. A character illustration on the left and style guide icons at the bottom add a friendly, professional touch to your presentation. This slide is ready to use for competitive analysis, growth rate comparisons, sales performance tracking, and various business data visualization needs.
Usage Points
-
Main Usage
This slide is optimized for comparing two key metrics over time. Use it to visualize competitive performance, market growth rates, sales and revenue trends, customer satisfaction changes, or any dual-variable business analysis that requires clear trend comparison.
-
How to Use
Replace the data points and line colors with your actual figures. You can maintain the black and red color scheme or customize it to match your corporate branding. Modify the year range and legend labels to fit your specific time period and data categories.
-
Recommended For
Executive reports, investor pitch decks, marketing performance analysis, market analysis sections in business plans, quarterly and annual performance presentations. Ideal for finance teams, marketing departments, business planning units, and sales teams presenting data-driven insights.
-
Slide Structure
Two line series (black and red), eight time intervals (2019–2026), eight data points per series, legend display, character illustration on the left side, and style guide reference area at the bottom.
Related Products
-

Line Graph and Future Outlook Text – Market Analysis and Competitive Advantage
#Market and Competitor Analysis #Graph #Future Outlook
-

Forward-looking Line Chart – Market Growth Prediction
#Market and Competitor Analysis #Graph #Future Outlook
-

Comparison Emphasis Line Graph & Explanatory Text – Market Analysis and Competitive Advantage
#Market and Competitor Analysis #Graph #Future Outlook
-

Camping Market Future Outlook Graph
#Market and Competitor Analysis #Graph #Future Outlook
