Sales Performance Comparison Slide – Market Analysis and Competitive Edge
RB0800014_14
- Last Update 03/20/2025
- File Size 0.1MB
- # of Slides 2
- File Format PPTX
- Slide Ratio 4:3
- Color
Keywords
- #Content-Based Slides
- #Design-Based Slides
- #Market and Competitor Analysis
- #Graph
- #Future Outlook
- #Competitive Advantage
- #Line
- #Line Chart
- #4:3
- #line chart PowerPoint slide
- #sales performance comparison template
- #market analysis chart
- #trend line graph
- #competitive advantage presentation
- #dual-series line graph PowerPoint
About the Product
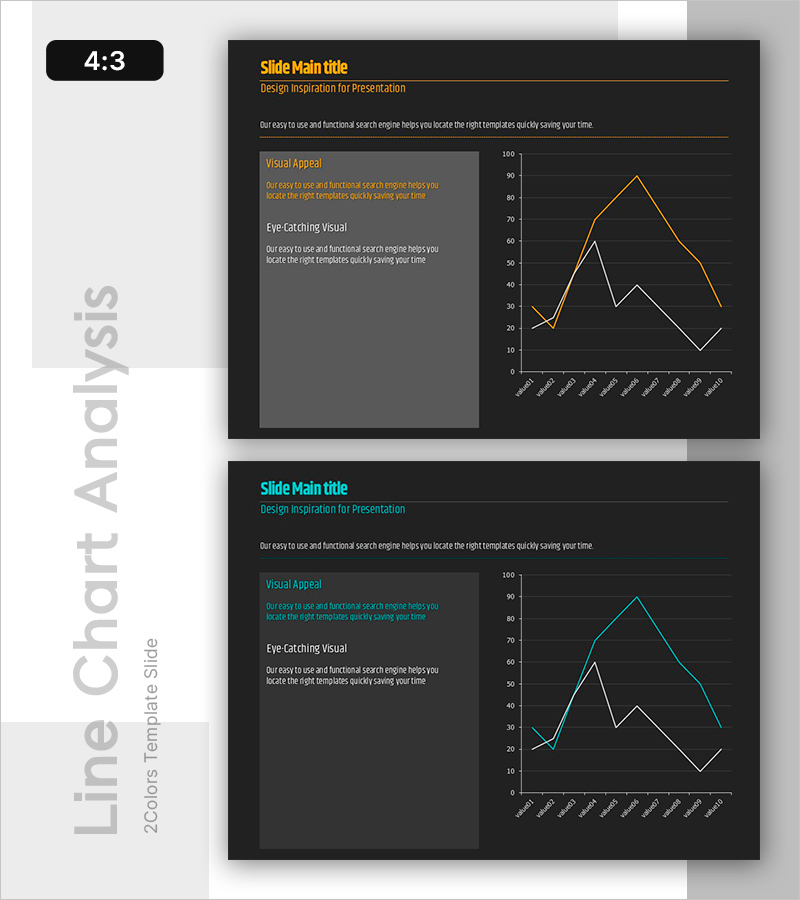
A dual-series line chart PowerPoint slide designed to compare sales performance and market analysis at a glance. The orange and white trend lines clearly visualize competitive advantage against rivals, while the left text area highlights key messages. Set against a dark background with high-contrast lines, this presentation template maximizes impact for business reports. Optimized for quarterly and monthly sales trend analysis, the 2-slide set is ready to use immediately.
Usage Points
-
Main Usage
Compare quarterly and monthly sales trends alongside competitor performance simultaneously. The contrast between the orange ascending line and white comparison line emphasizes your company's advantage, boosting credibility in market analysis and performance reporting sections.
-
How to Use
Enter your key insight or visual appeal message in the left text box, then replace the graph data values with actual sales figures. The high-contrast lines on the dark background display clearly on projector screens, making it ideal for large conference room presentations.
-
Recommended For
Sales team quarterly performance reports, executive-level business outcome presentations, investor pitch decks, marketing team market share analysis presentations. Particularly effective when comparing two or more data series to demonstrate competitive positioning.
-
Slide Structure
2-slide set with 40% left text area (title, subtitle, description text in 3 tiers) and 60% right graph area per slide. Line chart features 12 monthly X-axis items, 0–100 Y-axis range, 2 trend lines (orange and white), gridlines, and legend for optimal data readability.
Related Products
-

Camping Market Future Outlook Graph
#Market and Competitor Analysis #Graph #Future Outlook
-

Trend of Comparison Items in Line Chart – Emphasizing Market Outlook
#Market and Competitor Analysis #Graph #Future Outlook
-

Forward-looking Line Chart – Market Growth Prediction
#Market and Competitor Analysis #Graph #Future Outlook
-

Line Graph and Future Outlook Text – Market Analysis and Competitive Advantage
#Market and Competitor Analysis #Graph #Future Outlook
