Forward-looking Line Chart – Market Growth Prediction
RJ0600038_8
- Last Update 07/01/2025
- File Size 0.2MB
- # of Slides 2
- File Format PPTX
- Slide Ratio 16:9
- Color
Keywords
- #Content-Based Slides
- #Design-Based Slides
- #Market and Competitor Analysis
- #Graph
- #Future Outlook
- #Competitive Advantage
- #Line
- #Line Chart
- #16:9
- #line chart PowerPoint slide
- #dual-series line graph template
- #market trend analysis chart
- #2-series data comparison
- #how to create line chart in PowerPoint
- #market forecast slide download
About the Product
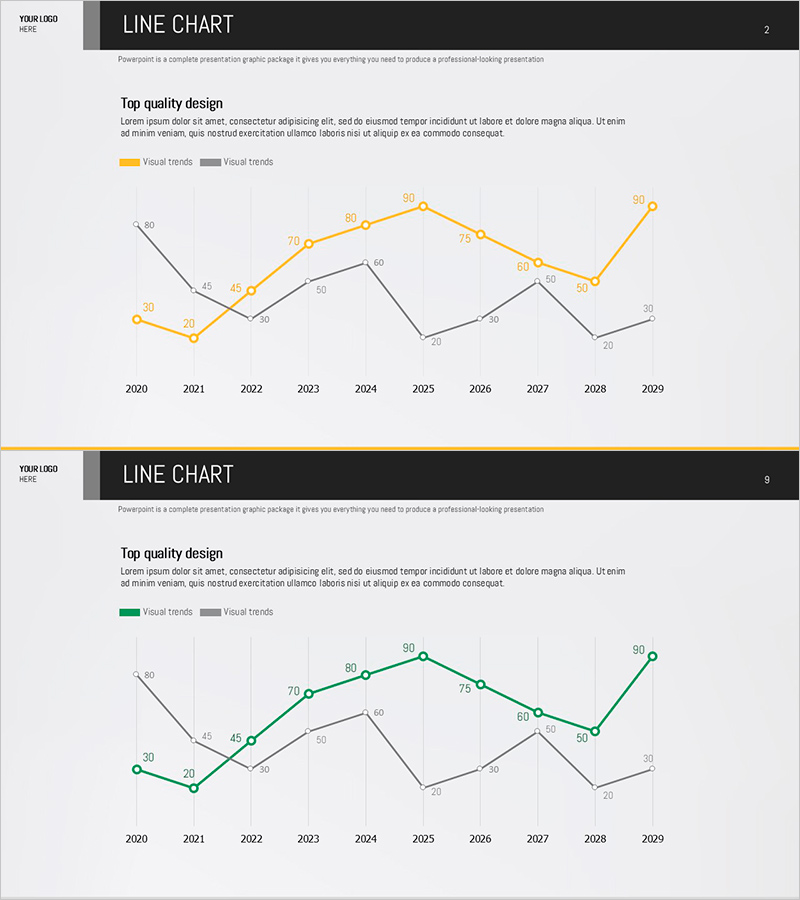
A professional line chart PowerPoint slide comparing two data series across a 20-year market forecast period from 2010 to 2029. The dual-line design uses orange and gray color coding to distinguish between two trend lines, with each data point clearly labeled with numerical values for precise comparison. The light gray grid background enhances readability and provides a clean, professional appearance suitable for executive presentations. This slide template is ready to use in business plans, market analysis reports, competitive benchmarking documents, and investor pitch decks to visualize growth projections and performance comparisons.
Usage Points
-
Main Usage
Visualize and compare two market trends or performance metrics over an extended time period. Ideal for demonstrating growth trajectories, competitive positioning, and future market projections in business plans, quarterly executive reports, investor presentations, and strategic planning documents.
-
How to Use
Replace the sample data with your actual figures by editing the data table linked to the chart. Modify series labels and legend text to match your presentation context. Adjust colors to align with corporate branding guidelines. Use the chart during live presentations to highlight specific years or inflection points by hovering with a pointer or using animation effects.
-
Recommended For
C-suite executives, business development managers, market analysts, financial planners, management consultants, and strategy teams. Suitable for business plan presentations, quarterly board reports, investor pitch meetings, market entry strategy discussions, and competitive analysis briefings.
-
Slide Structure
Dual-line chart with orange and gray series, 10 data points spanning 2010-2029, numerical labels on each point, dual-legend, title section, and descriptive text area. Optimized for 16:9 widescreen format as a 2-slide template set.
Related Products
-

Camping Market Future Outlook Graph
#Market and Competitor Analysis #Graph #Future Outlook
-

Comparison Emphasis Line Graph & Explanatory Text – Market Analysis and Competitive Advantage
#Market and Competitor Analysis #Graph #Future Outlook
-

Analysis of Reading Volume by Data – Market Status and Competitive Advantage
#Market and Competitor Analysis #Diagram #Graph
-

Create Line Charts with Rainbow Paper Template
#Market and Competitor Analysis #Graph #Future Outlook
