Red Purple Highlight Donut Chart - Market Share Analysis
RJ0500040_5
- Last Update 06/18/2025
- File Size 0.2MB
- # of Slides 2
- File Format PPTX
- Slide Ratio 16:9
- Color
Keywords
- #Content-Based Slides
- #Design-Based Slides
- #Business Introduction
- #Market and Competitor Analysis
- #Diagram
- #Graph
- #Technological Status
- #Market Share
- #Cluster
- #Circles
- #Closed Cluster Diagram
- #Doughnut Chart
- #16:9
- #donut chart PowerPoint slide
- #pie chart template download
- #market share data visualization
- #percentage ratio PPT
- #graph slide design
About the Product
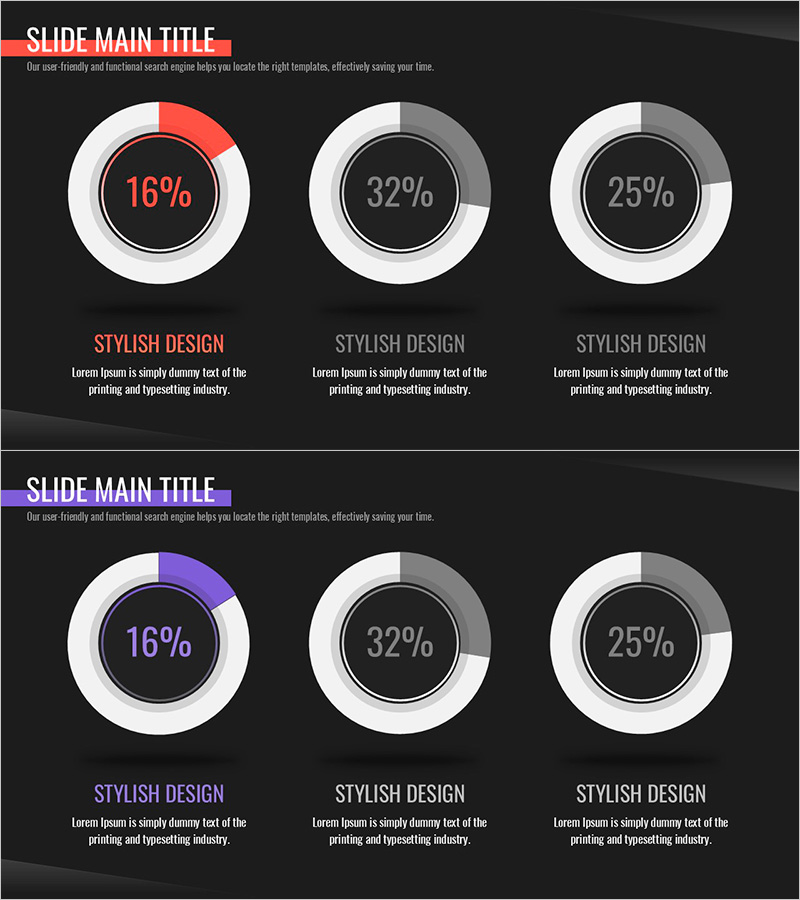
A donut-shaped pie chart PowerPoint slide designed to visualize market share, technology status, and data analysis. The red and purple accent colors highlight key metrics, while the white-bordered donut structure on a dark background clearly conveys percentage ratios. This 2-slide set is ready to apply to various data scenarios and optimized for modern 16:9 widescreen presentations. Perfect for cluster analysis, market research, technology status reports, and all business presentations requiring quantitative data visualization.
Usage Points
-
Main Usage
Intuitively express percentage-based data such as market share, technology status, and cluster analysis. Red and purple accent colors emphasize key metrics, while the dark background donut structure clearly conveys numerical comparisons. Suitable for all business presentations requiring quantitative data visualization.
-
How to Use
Replace the displayed percentages and legends with your own data for immediate use. Adjust the red and purple accent areas to highlight desired items. Insert into company profiles' market analysis sections, technology reports' status analysis, investment materials' competitive analysis, and various other documents.
-
Recommended For
Recommended for marketing professionals, planners, analysts, and executives requiring data-driven decision-making. Applicable to market research result sharing, technology status reporting, business performance analysis, competitive benchmarking, and all presentation scenarios conveying quantitative information.
-
Slide Structure
2-slide set featuring red-accented donut chart (16%), purple-accented donut chart (32%), and gray donut chart (25%) with 3-segment pie layouts. Each slide displays percentage values in the central circular area with descriptive text fields below to clearly communicate data context.
Related Products
-

Visualizing Subjects with Donut Charts – A Master of Information Delivery
#Product/Service Introduction #Business Introduction #Market and Competitor Analysis
-

Market Share by Instrument Visualization – Donut Chart for Market Analysis
#Market and Competitor Analysis #Diagram #Graph
-

Learning Icon and Donut Chart Ratio – Effective Market and Competitor Analysis
#Business Introduction #Market and Competitor Analysis #Graph
-

Market Share Donut Pie Chart – Visualization of Data Analysis
#Company Introduction #Market and Competitor Analysis #Diagram
