Space Theme Market Share Donut Pie Chart
RJ0400035_5
- Last Update 05/27/2025
- File Size 5.4MB
- # of Slides 2
- File Format PPTX
- Slide Ratio 16:9
- Color
Keywords
- #Content-Based Slides
- #Design-Based Slides
- #Business Introduction
- #Market and Competitor Analysis
- #Graph
- #Technological Status
- #Market Share
- #Circles
- #Doughnut Chart
- #16:9
- #donut chart PowerPoint slide
- #pie chart template
- #market share comparison
- #percentage visualization
- #space theme PowerPoint slide download
About the Product
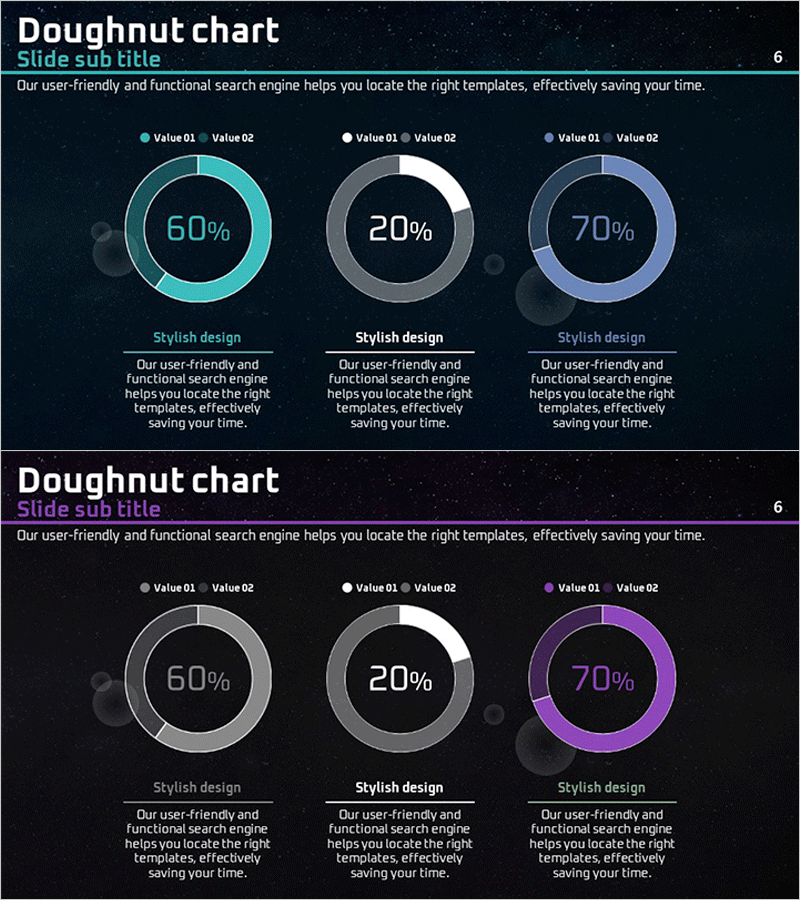
A space-themed donut pie chart PowerPoint slide featuring three color-coded donut charts in cyan, gray, and purple. This presentation template visualizes comparative data such as market share, technology status, and percentage distribution with central percentage values displayed in each donut ring. The dark space background with circular decorative elements adds visual depth and sophistication to your presentation. The 2-slide set is ready to download and edit immediately for various business scenarios.
Usage Points
-
Main Usage
This slide visualizes comparative data including market share, technology status, and percentage distribution using donut pie charts. The central percentage values and outer legend clearly communicate each segment's proportion, while the space theme background adds professionalism to technology presentations and market analysis reports.
-
How to Use
Use this template for investor presentations, technology status reports, and market analysis slideshows. Simply edit the donut colors and percentage values to match your data, and leverage the 2-slide layout to present multiple comparison items simultaneously.
-
Recommended For
Ideal for IT and technology companies presenting technology status, marketing teams analyzing market share, executives reporting business performance, and consulting firms presenting data analysis. The space theme effectively emphasizes innovation and forward-thinking vision.
-
Slide Structure
Both slides 1 and 2 feature identical layout: title area at top + 3 donut pie charts (cyan, gray, purple) + central percentage values (60%, 20%, 70%) + descriptive text area at bottom. Dark space background with circular decorative elements ensures visual consistency throughout.
Related Products
-

Donut Pie Chart for Medical Technology – Market Share Analysis
#Business Introduction #Market and Competitor Analysis #Graph
-

Pie Chart for Data Comparison – Quality and Color
#Business Introduction #Market and Competitor Analysis #Graph
-

Learning Icon and Donut Chart Ratio – Effective Market and Competitor Analysis
#Business Introduction #Market and Competitor Analysis #Graph
-

Scientific Analysis Donut Circle Graph
#Business Introduction #Market and Competitor Analysis #Graph
