Ice Hockey Competition Chart – Performance Analysis and Strategy
RJ0600045_5
- Last Update 07/03/2025
- File Size 0.4MB
- # of Slides 2
- File Format PPTX
- Slide Ratio 16:9
- Color
Keywords
- #Content-Based Slides
- #Design-Based Slides
- #Business Strategy
- #Market and Competitor Analysis
- #Graph
- #Other
- #Achievements
- #Competitive Advantage
- #Horizontal Bar
- #Double Horizontal Bar
- #Silhouette
- #16:9
- #dual bar chart PowerPoint
- #competitive analysis slide template
- #horizontal bar graph presentation
- #performance comparison PPT
- #sports analytics slide design
About the Product
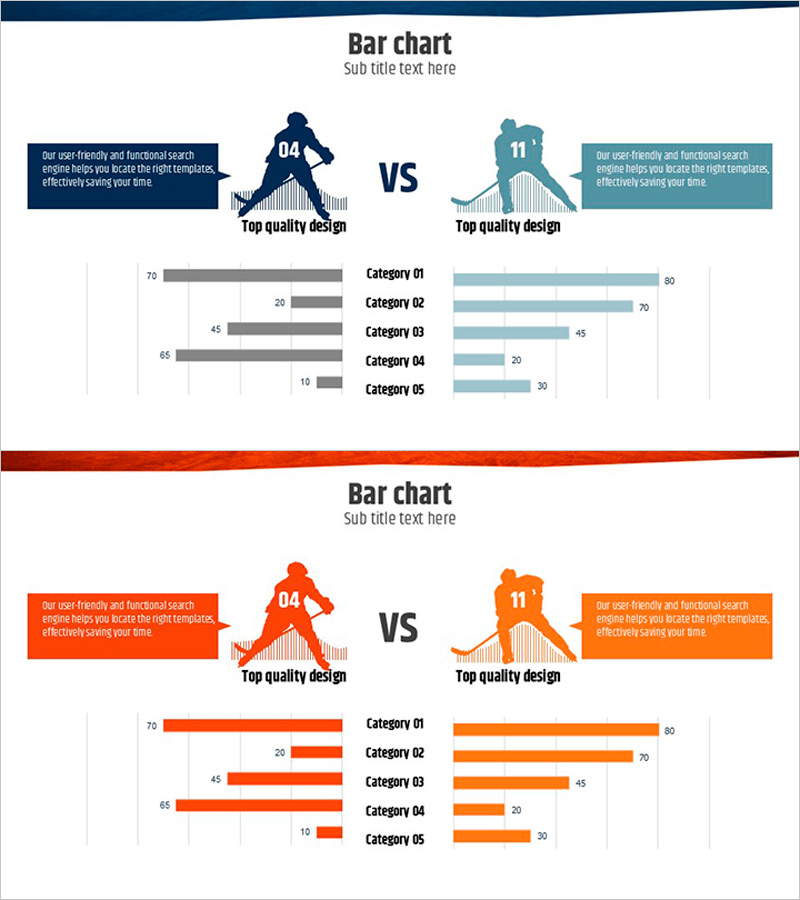
A dual horizontal bar chart PowerPoint slide designed for ice hockey competition analysis and performance comparison. The slide features a two-tone color scheme with dark gray bars on the left and light blue bars on the right, enabling direct comparison of five categories (Category 01 through 05) across two teams or entities. The upper section includes silhouette illustrations of athletes and a prominent 'VS' label to emphasize competitive positioning, with descriptive text boxes for each team. This template is immediately applicable to sports analytics, game performance reviews, marketing benchmarking, and sales comparison presentations.
Usage Points
-
Main Usage
Designed to compare two entities (teams, products, strategies, regions) across identical metrics and visually emphasize competitive relationships. Ideal for sports analytics, game performance reviews, sales comparisons, and marketing benchmarking presentations where side-by-side data comparison is essential.
-
How to Use
Enter team or product names on either side of the central 'VS' label, then adjust bar lengths to match your numerical data for each category. Add team strengths or differentiators in the text boxes to complete the competitive analysis. Colors can be customized to match your brand or team identity.
-
Recommended For
Sports analysts, game designers, marketing managers, sales directors, strategy consultants, and product managers presenting competitive comparisons, team performance metrics, market share analysis, or product benchmarking.
-
Slide Structure
2-slide deck. Slide 1: Dark navy header with centered 'VS' label, left silhouette in dark gray, right silhouette in light blue, descriptive text boxes for each entity. Slide 2: Five-category horizontal bar chart with dark gray bars (left) and light blue bars (right) plus numerical labels. 16:9 widescreen format, PPTX file.
Related Products
-

Blue Red Two-way Graph – Highlighting Competitive Advantage
#Business Strategy #Market and Competitor Analysis #Graph
-

Bar Chart Visualizing Steak Consumption
#Business Strategy #Market and Competitor Analysis #Graph
-

Business Analysis Bilinear Bar Graph
#Market and Competitor Analysis #Graph #Competitor Analysis
-

Data Analysis PPT for Households with Pets
#Business Strategy #Market and Competitor Analysis #Graph
