Competitive Strengths Comparison Chart – An Effective Market Analysis Tool
RB0100081_7
- Last Update 03/07/2025
- File Size 0.3MB
- # of Slides 2
- File Format PPTX
- Slide Ratio 4:3
- Color
Keywords
- #Content-Based Slides
- #Design-Based Slides
- #Product/Service Introduction
- #Market and Competitor Analysis
- #Diagram
- #Graph
- #Other
- #Development Status
- #Competitive Advantage
- #Cluster
- #Closed Cluster Diagram
- #4:3
- #concentric circle chart PowerPoint
- #competitive analysis diagram slide
- #3-layer comparison chart
- #market analysis template
- #competitive strengths visualization
About the Product
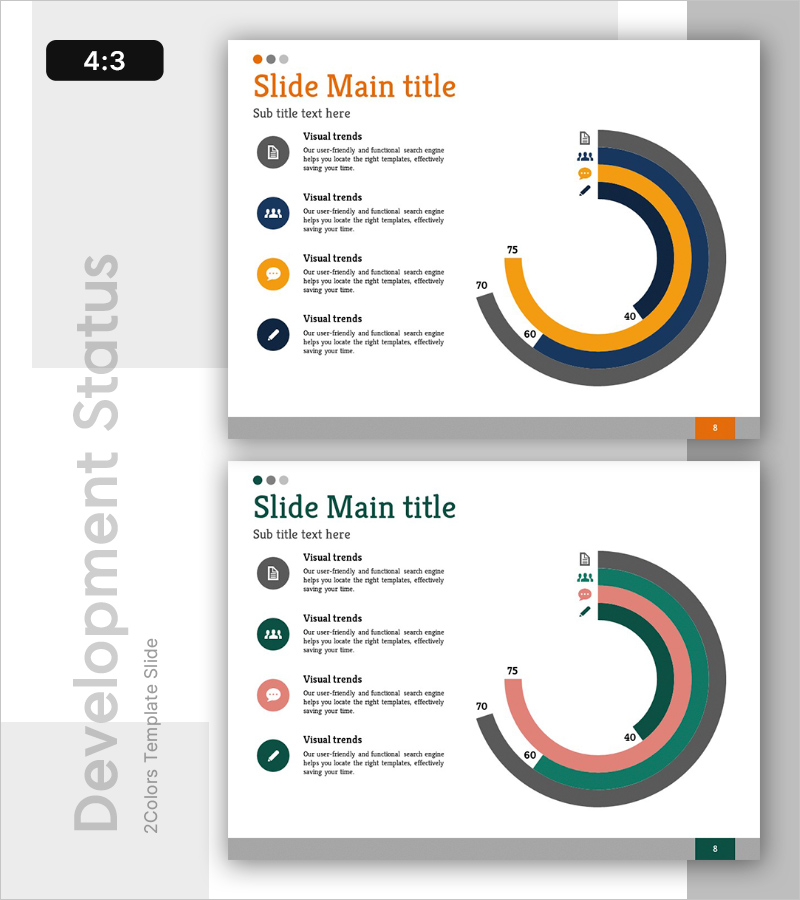
A PowerPoint slide featuring a 3-layer concentric circle diagram for visually comparing competitive strengths across multiple dimensions. The three rings are color-coded in orange, navy, and gray (or pink, green, and gray), with numerical values (40–75) at the center representing quantitative benchmarks. The left side displays four icon-labeled trend categories with descriptive text, while the right side showcases the concentric chart in a balanced layout. This design effectively communicates market analysis data and competitive positioning for business strategy presentations, product introductions, and corporate reports. Two color variations are included to match your brand identity and presentation context.
Usage Points
-
Main Usage
Visualize multi-dimensional competitive positioning by comparing your company's strengths against competitors across three key metrics simultaneously. The concentric layers represent different evaluation criteria (e.g., technology, pricing, customer satisfaction), while the numerical scale (40–75) provides quantitative comparison for data-driven decision-making.
-
How to Use
Replace the four icon-labeled categories on the left with your evaluation metrics (e.g., Technology, Marketing, Customer Service, Price Competitiveness). Update the numerical values in each concentric ring to reflect your benchmark scores. Select the color variation that matches your corporate branding and insert into executive presentations, investor pitches, or competitive analysis reports.
-
Recommended For
Marketing strategists, product managers, business development teams, and C-suite executives presenting competitive analysis to stakeholders. Particularly effective for B2B product positioning, market entry strategy presentations, quarterly business reviews, and investor relations meetings where complex multi-factor comparisons need clear visual communication.
-
Slide Structure
Left side contains four circular icons (document, team, chat, pen) arranged vertically with corresponding text descriptions. Right side displays a 3-layer concentric circle chart with numerical values (40–75) positioned at cardinal points. Both slides maintain identical structure with two color schemes: orange/navy/gray and pink/green/gray for flexible brand alignment.
Related Products
-

Cell Phone Development Status Analysis Chart – Competitive Advantage and Insights
#Product/Service Introduction #Market and Competitor Analysis #Diagram
-

Medical Research Progress Diagram – Innovation and Development
#Product/Service Introduction #Business Introduction #Diagram
-

Camera Donut Chart and Table – Market and Competitive Analysis
#Product/Service Introduction #Market and Competitor Analysis #Graph
-

User Experience Advantage Analysis Chart – Visualizing Competitive Edge
#Product/Service Introduction #Market and Competitor Analysis #Diagram
