Year-over-year Comparison Analysis Bar Graph – Market Trends and Insights
RJ0400045_26
- Last Update 05/29/2025
- File Size 3MB
- # of Slides 2
- File Format PPTX
- Slide Ratio 16:9
- Color
Keywords
About the Product
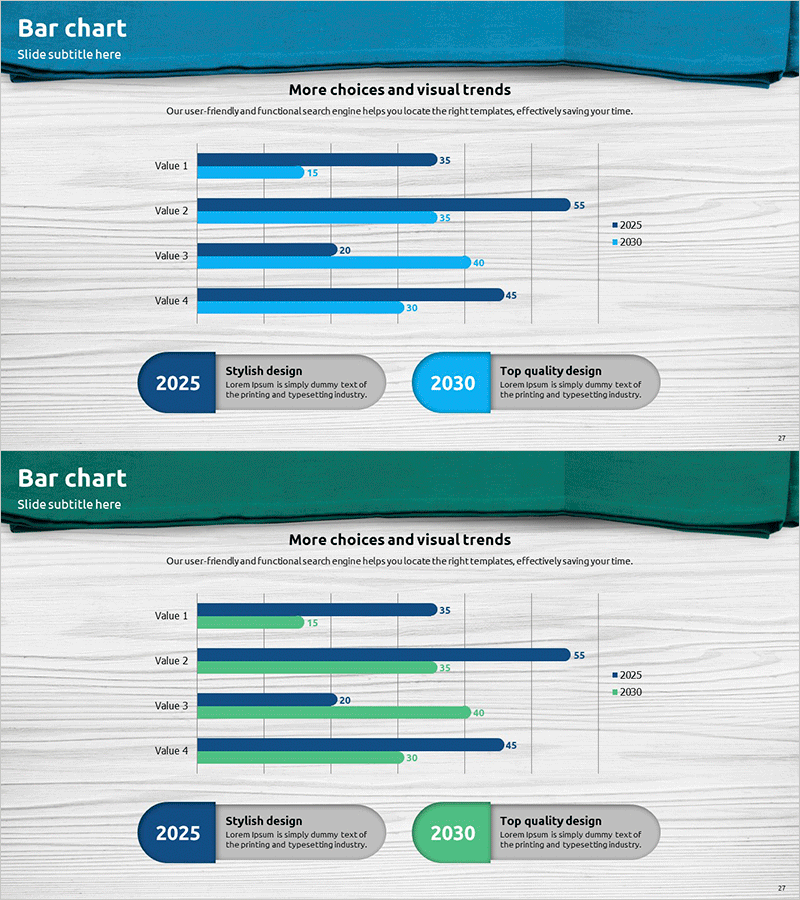
A dual-series horizontal bar chart PowerPoint slide comparing market data across four items for 2025 and 2030. The chart uses dark blue and light blue bars to clearly visualize year-over-year differences, with precise numerical labels on each bar for immediate presentation use. Grid background and legend support data interpretation, while description boxes below each year allow for adding key insights. Ideal for business presentations including market analysis, competitive benchmarking, and performance comparisons.
Usage Points
-
Main Usage
This horizontal bar chart slide is designed for comparing data across two time periods or scenarios. It effectively visualizes four metrics—such as market size, sales volume, customer satisfaction, or market share—showing changes and performance trends at a glance.
-
How to Use
Simply replace the bar lengths and numerical labels with your own data. The dark blue bars represent 2025 data and light blue bars represent 2030 data; adjust the legend and years to match your presentation context. Add key insights or findings in the description boxes below to strengthen your narrative.
-
Recommended For
Recommended for executive reports, business performance presentations, market analysis documents, competitive benchmarking, and investor pitch decks. Ideal for marketing teams, sales departments, business planning teams, and consultants presenting quantitative comparisons.
-
Slide Structure
The slide features a title area at the top, a 4-row dual-series horizontal bar chart in the center, a legend on the right (2025/2030), and two year-specific description boxes at the bottom. Each bar includes precise numerical labels, and the grid background facilitates easy data reading.
Related Products
-

Company Status Analysis Slide – Market and Competitor Analysis
#Company Introduction #Market and Competitor Analysis #Graph
-

Office Supplies Theme Bundle Bar Graph – Market Status Analysis
#Market and Competitor Analysis #Graph #Market Status
-

Cybersecurity Business Market Analysis Graph
#Market and Competitor Analysis #Graph #Competitor Analysis
-

Market Analysis Bar Graph – Effective Data Visualization
#Market and Competitor Analysis #Graph #Market Analysis
