Green & Gray Donut Chart Template – Perfect for Market Analysis
RJ0200067_26
- Last Update 04/18/2025
- File Size 0.8MB
- # of Slides 2
- File Format PPTX
- Slide Ratio 16:9
- Color
Keywords
About the Product
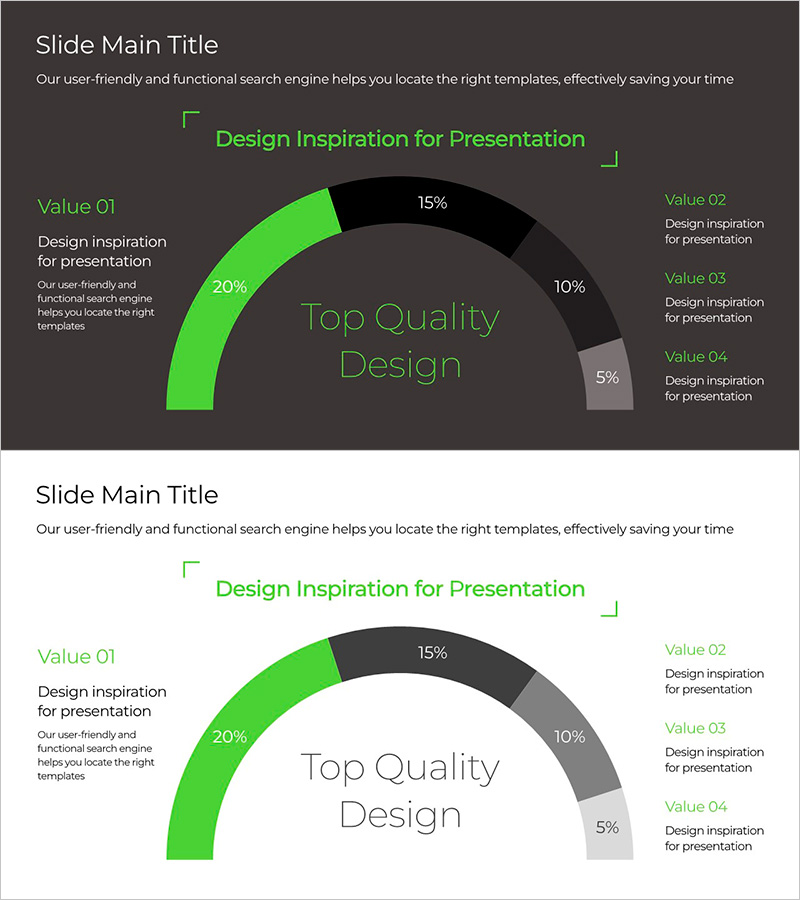
A professional donut chart PowerPoint slide designed for market analysis and business data presentation. The design combines bright green with dark gray and light gray tones to clearly visualize four data segments with their percentage values. The 2-slide set includes both dark and light background versions in 16:9 widescreen format, making it compatible with modern presentation environments. Each segment displays percentage labels and dedicated text areas for easy data input. The left-side text zones allow you to add detailed descriptions for each value, creating a flexible layout that supports comprehensive data storytelling in business presentations.
Usage Points
-
Main Usage
Perfect for displaying market share, sales ratios, customer composition, budget distribution, and other part-to-whole relationships. The donut structure allows you to place key metrics or titles in the center for visual emphasis. Simultaneously compare and analyze four data categories with clear percentage representation.
-
How to Use
Replace the percentage values in each segment with your actual data and update the label text with your category names. Use the left-side 'Value 01-04' areas to add detailed descriptions or supporting information for each segment. Colors can be customized to match your brand guidelines or presentation theme.
-
Recommended For
Ideal for marketing professionals, financial analysts, executive reports, business proposals, market research presentations, and quarterly performance reviews. Particularly suited for B2B business environments where data-driven decision-making presentations are essential.
-
Slide Structure
2-slide set featuring dark background and light background versions. Each slide contains a centered 4-segment donut chart with percentage labels, four text zones on the left (Value 01-04) for descriptions, and additional explanation space on the right. Formatted in 16:9 widescreen ratio for optimal display on modern presentation platforms.
Related Products
-

Network Service Market Share Analysis with Doughnut Chart
#Market and Competitor Analysis #Graph #Market Share
-

Big Data Comprehensive Analysis Chart – Insights for Market Analysis
#Business Introduction #Market and Competitor Analysis #Diagram
-

Travel Destination Infographic Market Share – Intuitive Data Visualization
#Market and Competitor Analysis #Graph #Market Share
-

Donut Chart of Causes of Environmental Pollution – Visualization of Data Analysis
#Market and Competitor Analysis #Graph #Market Analysis
