Asia Target Market Analysis Graph – Tremendous Visual Appeal
RJ0700003_7
- Last Update 07/22/2025
- File Size 0.9MB
- # of Slides 2
- File Format PPTX
- Slide Ratio 16:9
- Color
Keywords
- #Content-Based Slides
- #Design-Based Slides
- #Market and Competitor Analysis
- #Graph
- #Other
- #Market Analysis
- #Target Market
- #Horizontal Bar
- #Segmented Horizontal Bar
- #Map
- #16:9
- #Asia map PowerPoint slide
- #world map presentation template
- #market analysis chart
- #regional data visualization
- #stacked bar chart PowerPoint
About the Product
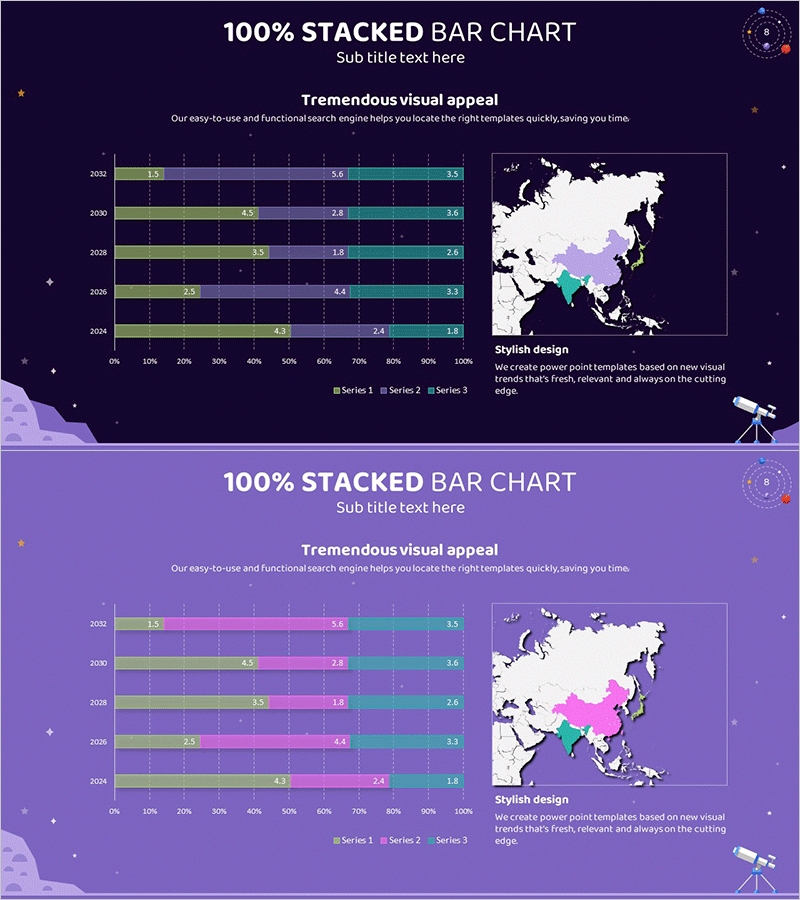
A world map-based PowerPoint slide designed for Asia market analysis presentations. The dark navy background features three distinct colors—lime, pink, and cyan—to differentiate regional data, while a 100% stacked horizontal bar chart on the right displays year-over-year trends across six years and three data series. The template includes two slide layouts: one with navy background and one with lavender background, allowing flexible integration into your presentation theme. Ideal for market entry strategies, regional performance reports, and geographic data comparison in executive briefings.
Usage Points
-
Main Usage
Visualize Asia-specific market metrics—market size, growth rates, market share—using both world map and stacked bar chart simultaneously, enabling clear regional comparison. Present geographic targeting strategies and data-driven decision-making to stakeholders.
-
How to Use
Color-code world map regions using lime, pink, and cyan to represent different market categories. Input actual data into the 100% stacked horizontal bar chart showing 2024–2032 trends across three data series. Select either dark navy or lavender background to match your overall presentation design.
-
Recommended For
Business development teams, marketing departments, and executives presenting international expansion strategies, regional sales analysis, and global network growth plans. Suitable for consulting firms, financial institutions, and manufacturing companies conducting market research presentations.
-
Slide Structure
Slide 1: Dark navy background with world map (Asia regions highlighted in 3 colors) + 100% stacked horizontal bar chart (6 years × 3 data series) / Slide 2: Lavender background with identical layout / Total 2 slides, 16:9 aspect ratio, PPTX format
Related Products
-

Regional Analysis Graphs – Visualizing Market Trends
#Market and Competitor Analysis #Graph #Other
-

Target Market Analysis Data Table - Market Growth Statistics
#Market and Competitor Analysis #Graph #Other
-

Target Country Analysis Chart – Data Visualization for Market Analysis
#Market and Competitor Analysis #Graph #Other
-

Gauge Charts by Region – Market Analysis and Competitiveness
#Market and Competitor Analysis #Graph #Other
