Target Country Analysis Chart – Data Visualization for Market Analysis
RJ0300063_6
- Last Update 05/05/2025
- File Size 4.8MB
- # of Slides 2
- File Format PPTX
- Slide Ratio 16:9
- Color
Keywords
- #Content-Based Slides
- #Design-Based Slides
- #Market and Competitor Analysis
- #Graph
- #Other
- #Market Analysis
- #Target Market
- #Horizontal Bar
- #Segmented Horizontal Bar
- #Map
- #16:9
- #world map PowerPoint slide
- #stacked bar chart template
- #country data visualization
- #market analysis PPT
- #horizontal bar graph download
About the Product
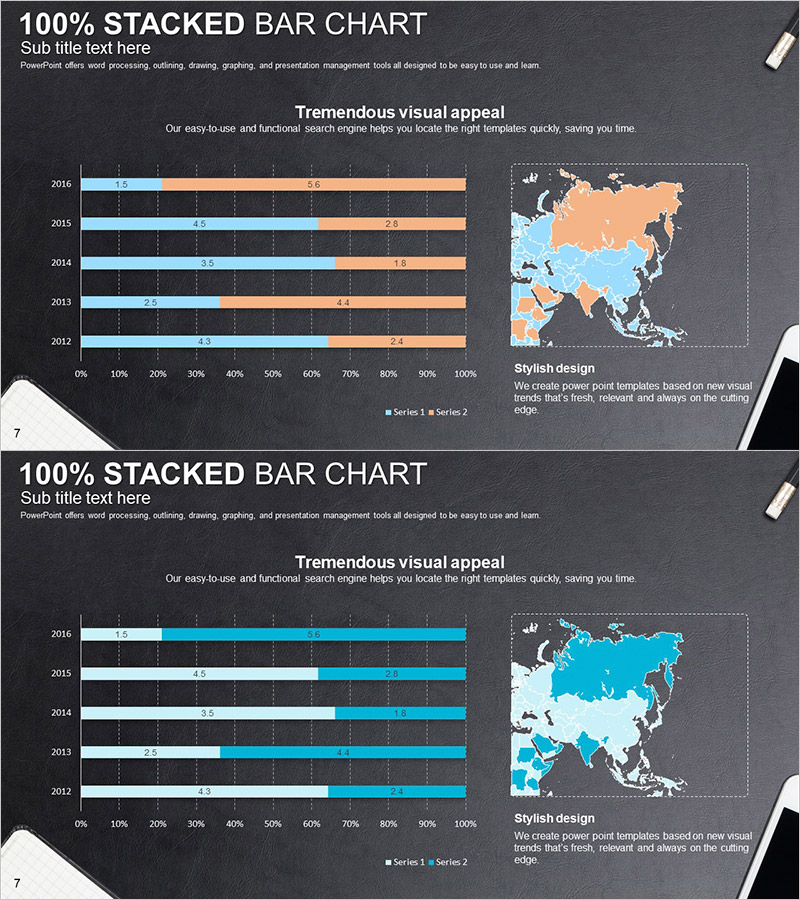
A comprehensive PowerPoint slide set for country-by-country market analysis and regional comparison using world map visualization. The 100% stacked horizontal bar chart displays two data series with blue and orange accent colors on a dark background, creating strong visual contrast. The world map shows country-level data distribution while the bar chart below compares year-over-year trends (2012–2016). This presentation template is ready to use for international market analysis, regional performance reporting, and global business strategy development in your PowerPoint presentations.
Usage Points
-
Main Usage
Present international market analysis and target country selection by displaying regional data simultaneously on both map and chart formats, providing visual evidence for global business strategy decisions. Year-over-year trends and country-level proportions are instantly comparable for investment decision-making materials.
-
How to Use
Highlight target countries on the world map slide using color coding, then input year-over-year performance data into the stacked bar chart slide. Maintain the blue-orange color palette while editing values and legend labels to reflect your market analysis results and regional data.
-
Recommended For
International business managers, marketing strategy teams, investment pitch deck creators, global market research analysts, and regional sales performance managers who need to conduct cross-country comparisons and develop regional expansion strategies.
-
Slide Structure
Slide 1: World map background with country-level data displayed in blue-orange dual-tone color coding for geographic data visualization / Slide 2: Five-year data (2012–2016) with two data series (Series 1 and Series 2) represented as 100% stacked horizontal bars for trend comparison
Related Products
-

Gauge Charts by Region – Market Analysis and Competitiveness
#Market and Competitor Analysis #Graph #Other
-

Target Country Year-by-Year Analysis Chart – Data Visualization for Market Analysis
#Market and Competitor Analysis #Graph #Other
-

Target Market Analysis Data Table - Market Growth Statistics
#Market and Competitor Analysis #Graph #Other
-

US Target Region Analysis Graph – Visualizing Market Status
#Market and Competitor Analysis #Graph #Other
