Target Country Year-by-Year Analysis Chart – Data Visualization for Market Analysis
RJ0400049_13
- Last Update 05/30/2025
- File Size 0.7MB
- # of Slides 2
- File Format PPTX
- Slide Ratio 16:9
- Color
Keywords
- #Content-Based Slides
- #Design-Based Slides
- #Market and Competitor Analysis
- #Graph
- #Other
- #Market Analysis
- #Target Market
- #Horizontal Bar
- #Segmented Horizontal Bar
- #Map
- #16:9
- #100% stacked bar chart PowerPoint
- #year-by-year data visualization
- #target country analysis slide
- #market analysis template
- #stacked bar graph download
- #comparative data chart
About the Product
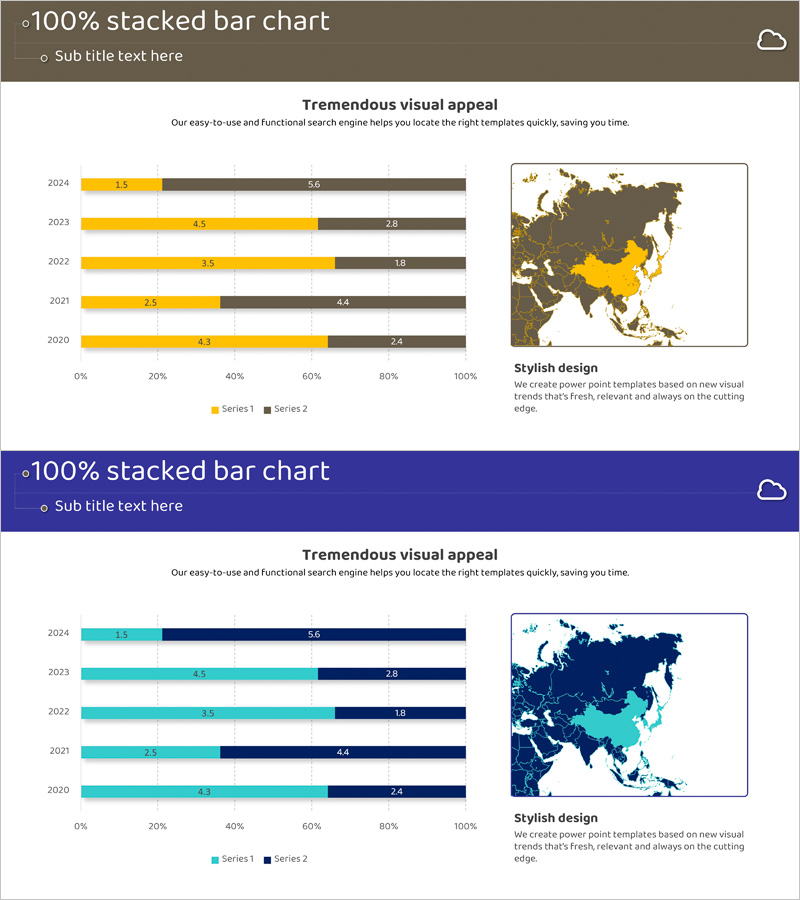
A 100% stacked bar chart PowerPoint slide designed for year-by-year target country market analysis from 2020 to 2024. The slide visualizes five years of data across two data series using a dual-tone color scheme—yellow and gray in the first version, and teal and navy blue in the second. Each year displays precise numerical values, making it immediately ready for business presentations and reports. The inclusion of a world map highlights regional market distribution, supporting data-driven decision-making for market strategy and business analysis.
Usage Points
-
Main Usage
Displays market size or sales volume trends across target countries over five years (2020–2024) using a 100% stacked bar format, simultaneously showing overall market growth and shifts in series proportions. The accompanying world map visually emphasizes regional market distribution.
-
How to Use
Use in executive reports, marketing strategy presentations, investor pitch decks, and business analysis documents to explain year-over-year market trends and regional market share. Edit the numerical values to match your company data and deploy immediately as a presentation slide.
-
Recommended For
Marketing managers, business planners, financial analysts, and executives presenting market analysis findings. Particularly suitable for global market expansion strategies, regional sales performance reviews, and year-over-year comparative presentations.
-
Slide Structure
Two-slide set: First slide features a yellow-and-gray 100% stacked bar chart (5 years × 2 data series); second slide uses teal-and-navy color scheme with identical structure. World map positioned on the right side of each slide to emphasize regional targets. 0–100% scale with year-by-year numerical labels included.
Related Products
-

Asia Target Market Analysis Graph – Tremendous Visual Appeal
#Market and Competitor Analysis #Graph #Other
-

Target Market Analysis Data Table - Market Growth Statistics
#Market and Competitor Analysis #Graph #Other
-

US Target Region Analysis Graph – Visualizing Market Status
#Market and Competitor Analysis #Graph #Other
-

Gauge Charts by Region – Market Analysis and Competitiveness
#Market and Competitor Analysis #Graph #Other
