Sales Activity Comparison Graph - Market and Competitor Analysis
RM0600003_27
- Last Update 02/23/2025
- File Size 0.3MB
- # of Slides 2
- File Format PPTX
- Slide Ratio 16:9
- Color
Keywords
- #Content-Based Slides
- #Design-Based Slides
- #Market and Competitor Analysis
- #Financial Plans and Performance
- #Graph
- #Other
- #Competitor Analysis
- #Projected Return on Investment (ROI)
- #16:9
- #dividend trend PowerPoint slide
- #dividend chart presentation template
- #financial performance PPT
- #investor presentation dividend slide
- #how to visualize dividend growth in PowerPoint
About the Product
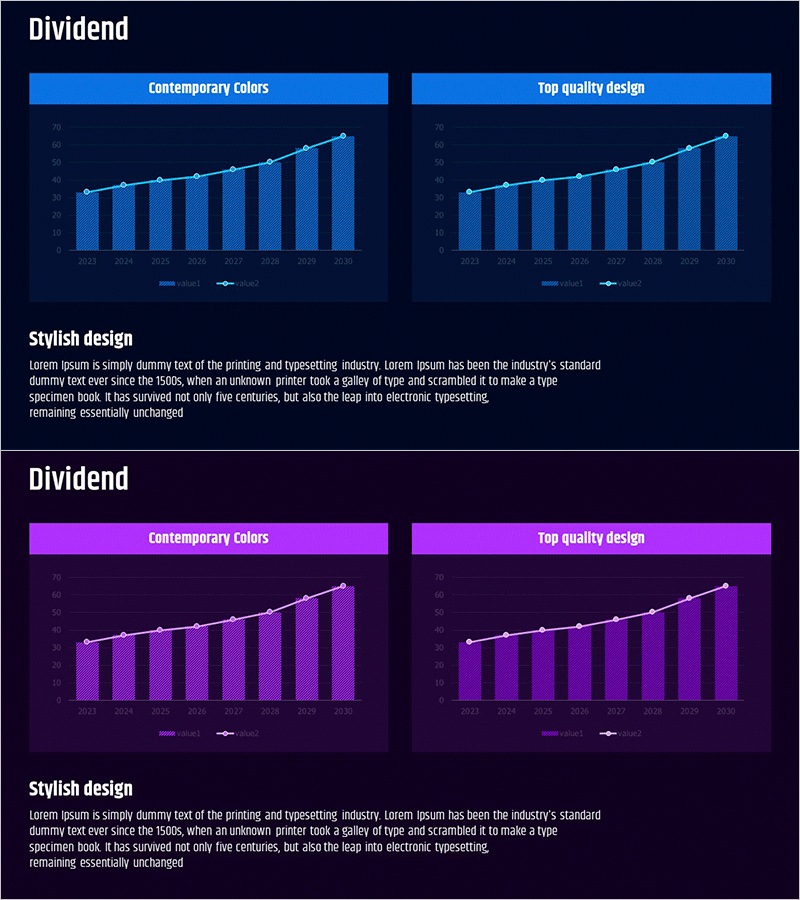
A 2-slide PowerPoint presentation visualizing dividend trends with dual chart designs. The left slide features 'Contemporary Colors' styling while the right displays 'Top quality design' approach, both presenting identical data in different visual formats. Set against a dark navy background, bright blue bar charts and ascending trend lines clearly communicate year-over-year dividend changes. Ideal for investor presentations, shareholder meetings, and financial reports emphasizing stable dividend policies. Optimized for 16:9 widescreen format with fully editable text areas, legends, and data fields for seamless customization.
Usage Points
-
Main Usage
Clearly communicate year-over-year dividend performance to investors and shareholders, demonstrating consistent dividend policy and financial growth. Two design options allow selection based on presentation context and audience preferences.
-
How to Use
Integrate into IR materials, shareholder meeting presentations, and annual financial reports within the dividend section. Replace bar heights and trend line data with actual dividend figures, then edit legends and axis labels for immediate deployment.
-
Recommended For
Finance teams, investor relations (IR) professionals, CFOs, and corporate executives presenting dividend policies to shareholders and potential investors. Suitable for financial institutions, publicly traded companies, and asset management firms.
-
Slide Structure
Two-slide format. Each slide contains a title area (Contemporary Colors / Top quality design), central dual-chart section with bar graphs and trend lines, and lower text description area. All elements are fully editable and customizable.
Related Products
-

Dividend Analysis Graph for the Last 6 Years – Financial Performance Insights
#Market and Competitor Analysis #Financial Plans and Performance #Graph
-

Dividend Yield Comparison Analysis Chart – Visualizing Investment Performance
#Market and Competitor Analysis #Financial Plans and Performance #Graph
-

Dividend Analysis Graph - Clarifying Financial Performance
#Market and Competitor Analysis #Financial Plans and Performance #Graph
-

Dividend Analysis Chart & Dividend Policy – Insights into Market and Performance
#Market and Competitor Analysis #Financial Plans and Performance #Diagram
