Gradient Theme Area Diagram – Market and Competitor Analysis
RJ0300060_28
- Last Update 05/04/2025
- File Size 0.8MB
- # of Slides 2
- File Format PPTX
- Slide Ratio 16:9
- Color
Keywords
- #Content-Based Slides
- #Design-Based Slides
- #Market and Competitor Analysis
- #Diagram
- #Graph
- #Other
- #Competitor Analysis
- #Market Analysis
- #Table
- #Other
- #Standard Table
- #Area Chart
- #16:9
- #area chart PowerPoint
- #area diagram slide template
- #market analysis presentation
- #competitor analysis slide
- #gradient chart PowerPoint
- #how to create area chart in PowerPoint
About the Product
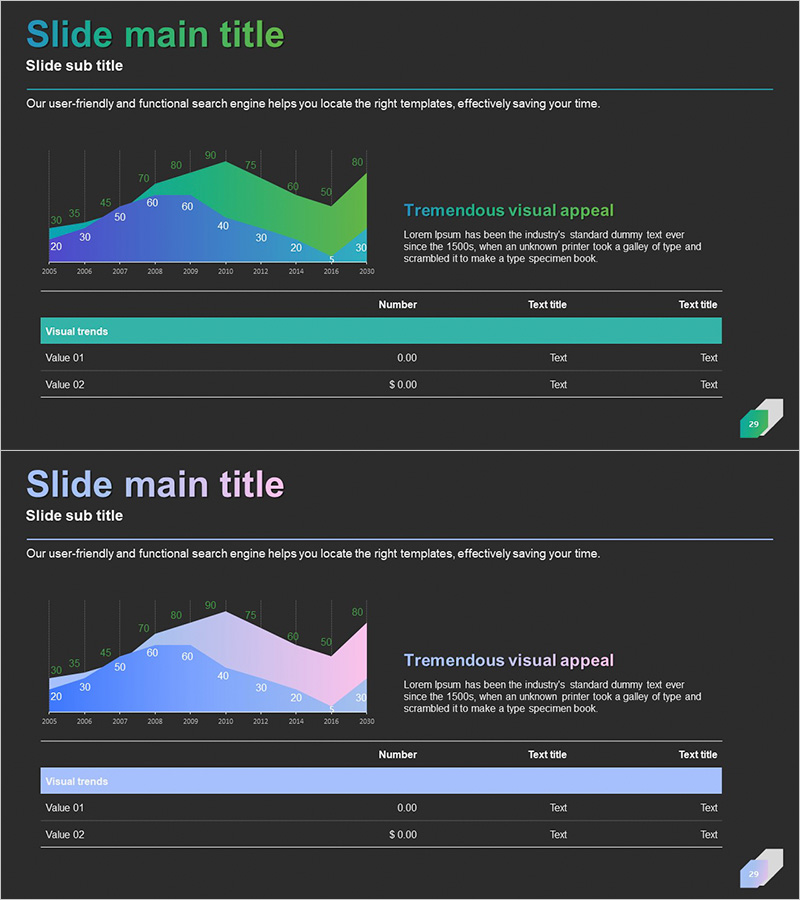
An area diagram PowerPoint slide optimized for market analysis and competitor comparison. This presentation template features a 2-series area chart with blue-to-green gradient effect, visualizing numerical changes and trends across two categories over time. Data points span from 2009 to 2020, with a dedicated text area at the top for emphasizing key messages. The 2-slide deck in 16:9 widescreen format is fully editable and ready to use in business presentations, reports, and strategic proposals.
Usage Points
-
Main Usage
Visualize numerical trends of two data series over time using an area chart, ideal for market share analysis, revenue trends, and competitive benchmarking. The gradient color scheme provides clear visual distinction while maintaining intuitive data flow and professional appearance.
-
How to Use
Enter your analysis title and subtitle in the header section, then add key insights in the right-side text box. Replace the sample data in the table with your own figures, and the chart automatically updates. Insert into business reports, marketing plans, and investor presentations.
-
Recommended For
Executives, marketing teams, planning departments, and sales teams presenting market conditions, competitive analysis, revenue trends, and customer satisfaction metrics. Suitable for quarterly and annual performance reports, business proposals, and investor pitch decks.
-
Slide Structure
2-slide deck with consistent layout: title and subtitle at top, dual-series area chart in center (2009-2020 data points), emphasis text box on right side, and data entry table at bottom. Blue-green gradient differentiates the two series. 16:9 widescreen format throughout.
Related Products
-

Office Supplies Theme Area Graph – Market Analysis and Competitor Comparison
#Market and Competitor Analysis #Graph #Other
-

Three-Dimensional Graph Analysis – Market and Competitor Analysis Slide
#Product/Service Introduction #Market and Competitor Analysis #Marketing Plan and Strategy
-

Competitor Analysis Graphs & Tables – Delivering Market Insights
#Market and Competitor Analysis #Diagram #Graph
-

Stylish Bar Chart Slide Design
#Market and Competitor Analysis #Diagram #Graph
