Child Silhouette and Figures – Visualizing Customer Insights
RJ0500022_16
- Last Update 06/13/2025
- File Size 3.7MB
- # of Slides 2
- File Format PPTX
- Slide Ratio 16:9
- Color
Keywords
- #Content-Based Slides
- #Design-Based Slides
- #Product/Service Introduction
- #Market and Competitor Analysis
- #Graph
- #Other
- #Product and Service Overview
- #Customer Analysis
- #Silhouette
- #16:9
- #customer analysis PowerPoint slide
- #silhouette infographic design
- #comparison analysis presentation
- #market insight visualization
- #customer segmentation PPT
About the Product
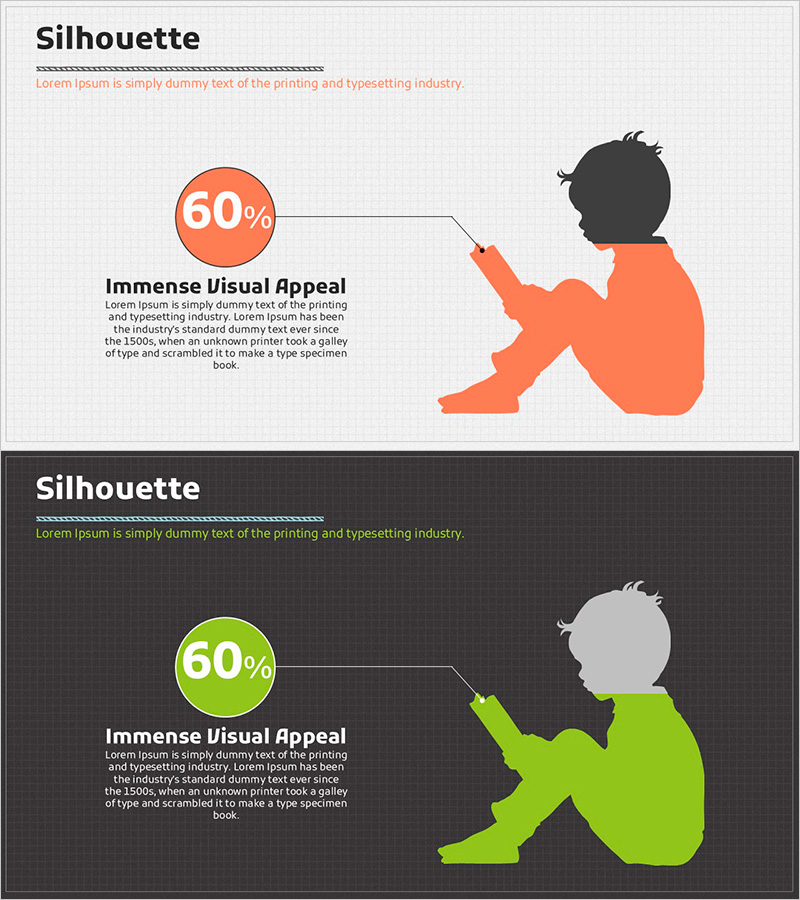
A visually compelling PowerPoint slide deck that transforms customer insights into silhouette-based infographics. This 2-slide set combines human silhouettes with numerical data on contrasting orange and green backgrounds, perfect for customer analysis, market understanding, and product positioning sections. The asymmetrical layout places percentage figures in circular charts on the left and silhouette figures on the right, maximizing information clarity. Ample text areas accommodate customer segmentation details, market share comparisons, and competitive analysis. Two background versions—light and dark—adapt to any presentation theme, making it ideal for daytime pitches or evening boardroom presentations.
Usage Points
-
Main Usage
Visualize quantitative customer data—market share, demographic segments, competitive positioning—alongside human silhouettes to enhance audience comprehension. Serves as a cornerstone slide for product introductions, market analysis, and strategic positioning sections, supporting data-driven decision-making.
-
How to Use
Input percentage figures and numerical data into the left-side circular chart area, then populate the right-side text boxes with customer characteristics, market trends, or competitive insights. Select the light background for daytime presentations or the dark version for evening sessions and dark-themed decks.
-
Recommended For
Marketing strategists, sales teams, product managers, and executives presenting customer research findings. Ideal for startup pitch decks, business plans, product launch presentations, and market positioning reports where visual impact and data clarity are essential.
-
Slide Structure
Two-slide set with asymmetrical 2-column layout: left side features title, percentage figures, and circular chart; right side displays human silhouette and descriptive text areas. Accommodates 3–4 text input zones for customer segments, market trends, competitive analysis, and supporting narratives.
Related Products
-

User Analysis Graph Visualization – Market and Customer Insights
#Market and Competitor Analysis #Graph #Other
-

Travel Business Target Market and Customer Analysis Slide
#Market and Competitor Analysis #Graph #Other
-

Human Details Infographic Chart – Customer Analysis and Market Overview
#Market and Competitor Analysis #Graph #Other
-

Collaboration Silhouette Diagram – Visual Tool for Customer Analysis
#Market and Competitor Analysis #Graph #Other
