Learning Content Customer Analysis Slide - Intuitive Graphs and Data Visualization
RJ0500022_15
- Last Update 06/13/2025
- File Size 3.7MB
- # of Slides 2
- File Format PPTX
- Slide Ratio 16:9
- Color
Keywords
- #Content-Based Slides
- #Design-Based Slides
- #Market and Competitor Analysis
- #Marketing Plan and Strategy
- #Graph
- #Other
- #Customer Analysis
- #Key Marketing Activities
- #16:9
- #customer analysis PowerPoint slide
- #infographic presentation template
- #ratio comparison slide
- #marketing analysis presentation
- #data visualization slide
About the Product
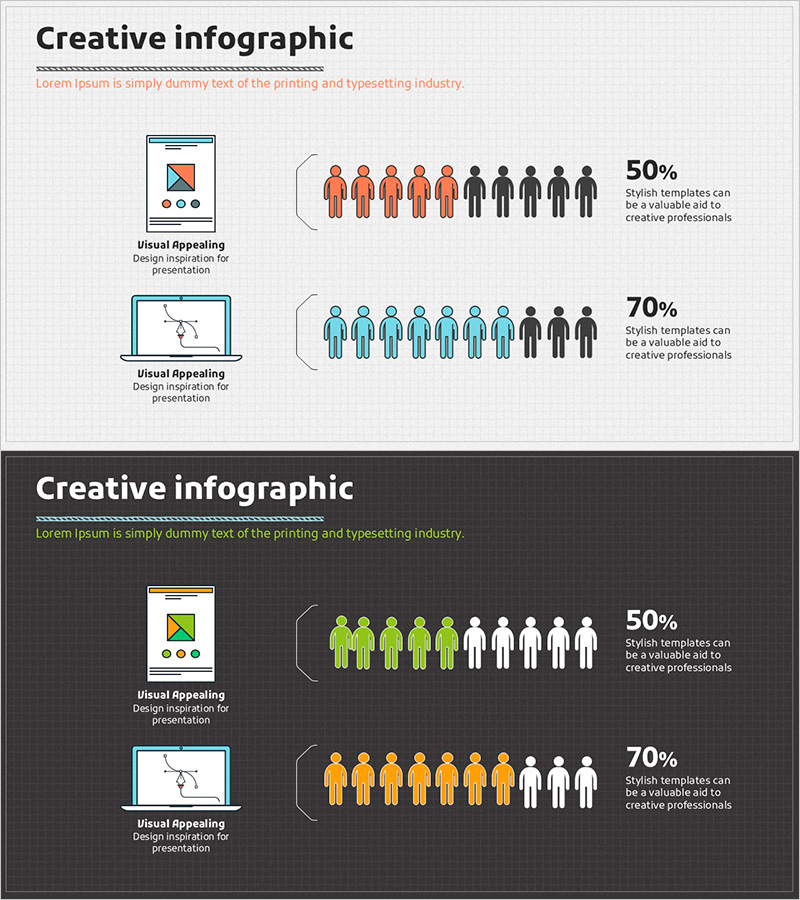
A PowerPoint slide designed to communicate customer segmentation data intuitively when developing marketing strategies. The layout features icons on the left (notebook and hand gesture) paired with a right-side human icon ratio comparison, using orange, blue, and black tones for clear visual contrast. Two versions are included—light background and dark background—making it immediately applicable for customer analysis, market analysis, and marketing activity presentations. Formatted as a 2-slide, 16:9 ratio PPTX file with clearly defined text areas and data input spaces for easy customization.
Usage Points
-
Main Usage
Optimized for visually communicating customer segmentation, target market analysis, and customer characteristic comparisons during marketing strategy development. Human icons and percentage figures enable stakeholders to grasp customer group ratio differences at a glance, supporting data-driven decision-making.
-
How to Use
Insert into the market analysis section of marketing plans, business proposals, or customer analysis reports. Replace the left icon area with analysis item names (visual appeal, template utility, etc.) and update the right-side human ratios and percentages with actual data.
-
Recommended For
Marketing managers, business planning teams, market analysis specialists, and investment pitch presenters use this slide to convey customer analysis findings persuasively to executives, investors, and partners. Particularly effective for presenting customer satisfaction rates, market share, and target customer ratio comparisons.
-
Slide Structure
Two-slide composition with each slide containing left-side icons (notebook and hand gesture) + center text input area + right-side human icon ratio display + percentage value section. Light background and dark background versions are included separately, allowing selection to match overall presentation tone.
Related Products
-

Collaboration Silhouette Diagram – Visual Tool for Customer Analysis
#Market and Competitor Analysis #Graph #Other
-

Customer Analysis and Target Setting Slide Template - Infographic for Market Understanding
#Market and Competitor Analysis #Marketing Plan and Strategy #Graph
-

Gender Analysis Graph – Stylish Slide for Customer Analysis
#Market and Competitor Analysis #Marketing Plan and Strategy #Graph
-

Bar Graph Visualizing Elderly Population Ratio
#Market and Competitor Analysis #Graph #Other
