User Gender Ratio Analysis Diagram
RJ0300046_29
- Last Update 04/30/2025
- File Size 3.4MB
- # of Slides 2
- File Format PPTX
- Slide Ratio 16:9
- Color
Keywords
About the Product
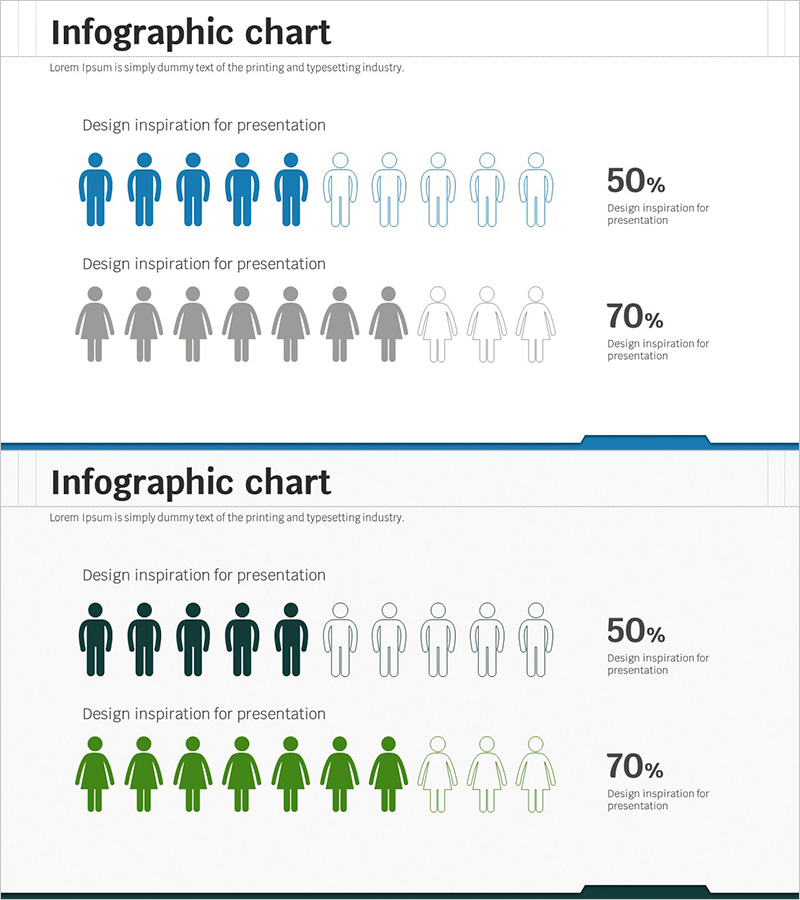
An essential slide for customer analysis and market research presentations. This PowerPoint slide visualizes gender distribution using icon-based infographics, ready to integrate into your presentation materials. The 2-slide set features a blue-toned male ratio analysis on the first slide and a gray-toned female ratio analysis on the second. Each slide displays 10 icons with filled icons representing percentages, making numerical data intuitive and easy to understand. Ample text input areas allow you to add analysis titles and descriptions, enhancing audience comprehension during presentations.
Usage Points
-
Main Usage
Designed to present gender demographic data in customer segmentation analysis, market research findings, and user statistics. The icon-based infographic transforms complex numerical data into instantly comprehensible visuals, making it ideal for marketing reports, sales presentations, and executive briefings.
-
How to Use
Enter your analysis title in the text input area (e.g., 'Target Customer Gender Distribution', 'User Demographics by Gender') and update the percentage figures with your actual data. Icon colors and background tones are fully editable to match your corporate branding. Use both slides consecutively or select individual slides as needed for your presentation.
-
Recommended For
Perfect for marketing strategy documents, market analysis reports, business plans, investor pitch decks, and customer analysis presentations. Particularly effective for gender-targeted strategy sections, customer segmentation analysis, and user statistics, enhancing data credibility and visual impact.
-
Slide Structure
2-slide set: First slide contains title area + 10 male icons (5 filled, 5 empty) + 50% percentage display + description text field. Second slide includes title area + 10 female icons (7 filled, 3 empty) + 70% percentage display + description text field. Each slide is independently editable, allowing ratio adjustments by modifying icon fill states.
Related Products
-

Survey Results by Region on Men and Women – Visual Trends Analysis
#Market and Competitor Analysis #Graph #Other
-

Data Visualization Slide Template Featuring World Map
#Market and Competitor Analysis #Graph #Other
-

Analysis of the Gender Ratio of Users in the US Market – A Blend of Teal and Gray
#Market and Competitor Analysis #Graph #Other
-

Customer Analysis by Country Slide – Market Trends and Insights
#Market and Competitor Analysis #Graph #Other
