Usage Status and Trends by Application Graph - Horizontal & Vertical Bar Utilization
RJ0400038_5
- Last Update 05/27/2025
- File Size 4.8MB
- # of Slides 2
- File Format PPTX
- Slide Ratio 16:9
- Color
Keywords
About the Product
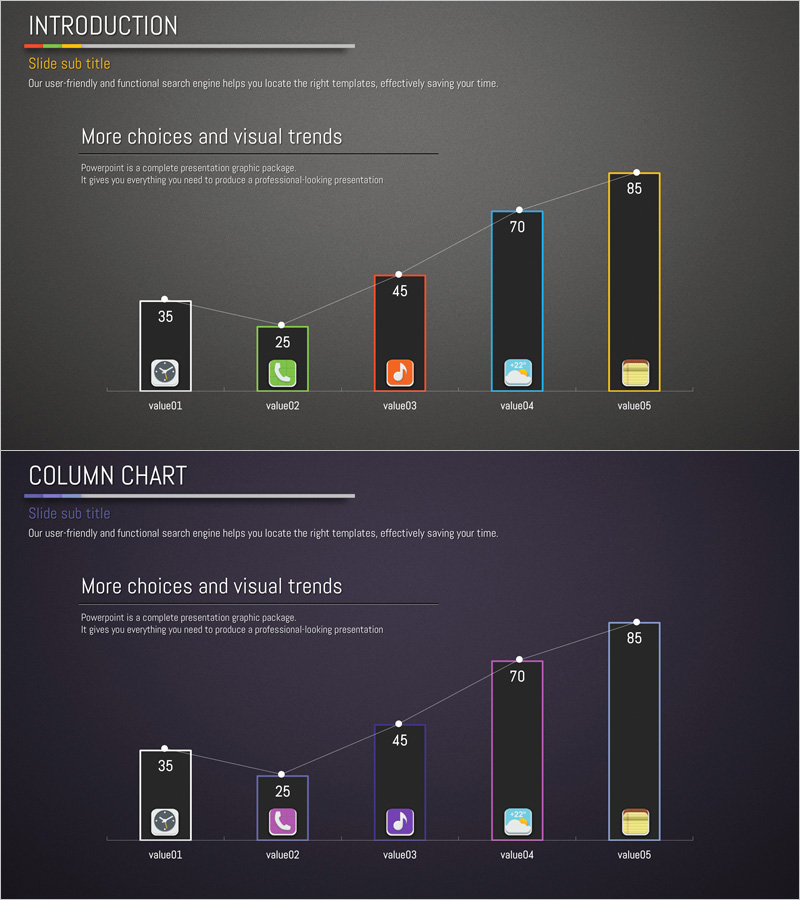
A 2-slide PowerPoint presentation template for visualizing application usage status and market trends. The first slide displays five data points as vertical bars with white borders and color-coded icons for each category. The second slide presents the same data in horizontal bar format to facilitate comparative analysis. Set against a dark gray background with white typography, the template uses five distinct color series—red, green, orange, blue, and yellow—to differentiate each item. Ideal for business presentations, market reports, and performance dashboards where multi-item numerical data requires dual-perspective visualization.
Usage Points
-
Main Usage
Presents multi-item numerical data—such as application usage statistics, market share, user adoption rates, or performance metrics—in two complementary visual formats. The dual-perspective approach (vertical and horizontal bars) enables audiences to grasp both absolute values and comparative rankings simultaneously.
-
How to Use
Use the first slide's vertical bar chart to emphasize individual item values and highlight peaks. Deploy the second slide's horizontal bar format to clarify ranking and facilitate side-by-side comparison. Edit the numerical values and category labels to input your actual data; the chart structure remains fully editable.
-
Recommended For
Marketing professionals presenting market analysis, sales teams reporting product performance, executives reviewing business metrics, management consultants delivering data-driven proposals, and researchers presenting statistical findings.
-
Slide Structure
Slide 1: Title area + 5 vertical bars (values ranging 35–85) + color-coded icons per category + descriptive text. Slide 2: Identical data in horizontal bar layout + 5 categories positioned left + numerical values right-aligned. Dark gray background, white typography, 5-color accent series with connecting lines.
Related Products
-

3D Vertical Graph Market Status – Premium Template for Market Analysis
#Business Introduction #Market and Competitor Analysis #Graph
-

Business Trends and Market Status Visualization Slide Template – Ideal for Insights and Analysis
#Business Introduction #Market and Competitor Analysis #Graph
-

Triangular Bar Graph of Learning Metrics – Market and Competitor Analysis
#Market and Competitor Analysis #Graph #Market Status
-

Market Overview PowerPoint Slide – Two Panel Market Analysis
#Market and Competitor Analysis #Graph #Market Status
