Business Trends and Market Status Visualization Slide Template – Ideal for Insights and Analysis
RJ0400039_13
- Last Update 05/28/2025
- File Size 0.2MB
- # of Slides 2
- File Format PPTX
- Slide Ratio 16:9
- Color
Keywords
About the Product
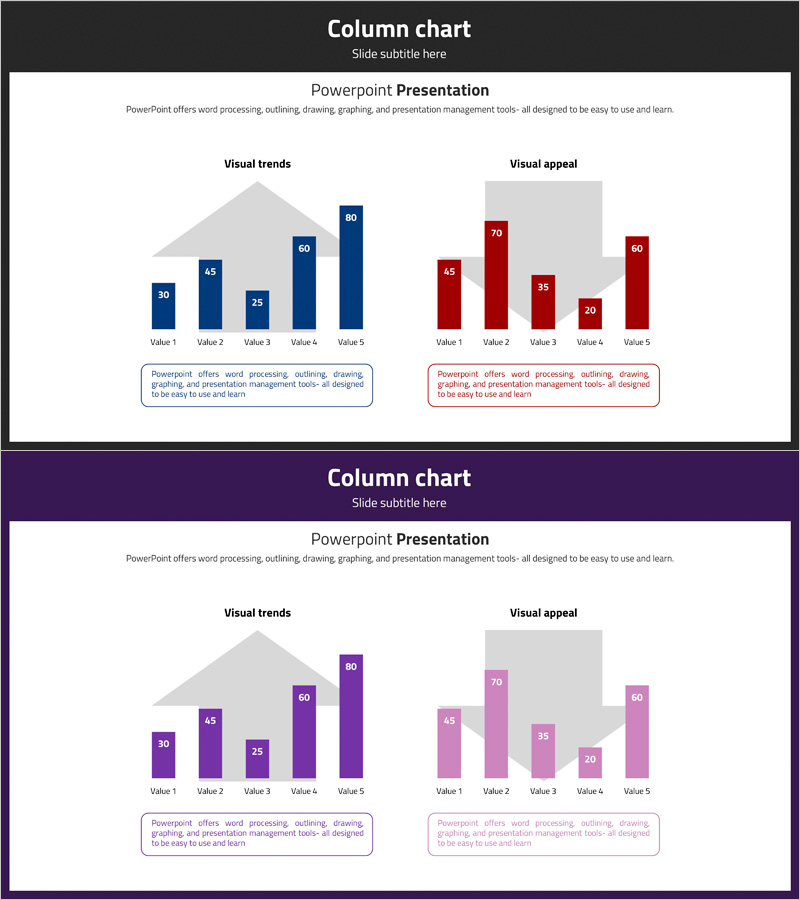
A PowerPoint slide that visualizes business trends and market status using horizontal bar charts with 5 data items. The 2-slide set presents two distinct data representation approaches: 'Visual Trends' and 'Visual Appeal,' utilizing navy blue, red, and purple color schemes for clear numerical comparison. Each slide features a triangular background element and information boxes to enhance presentation credibility. Optimized for 16:9 widescreen format and delivered as fully editable PPTX files, making it ready for immediate customization and deployment in professional presentations.
Usage Points
-
Main Usage
Designed to compare and analyze 5 data items such as business trends, market conditions, sales performance, and customer satisfaction using horizontal bar charts. The distinct navy blue and red color schemes enable intuitive comparison, while triangular background elements add visual interest and engagement to your presentation.
-
How to Use
Ideal for executive reports, business plans, marketing proposals, and quarterly performance presentations where numerical comparison is essential. The bar heights and colors allow audiences to instantly grasp rankings and performance metrics, while information boxes accommodate additional context and supporting details.
-
Recommended For
Recommended for executives, marketing managers, sales directors, consultants, and financial analysts who rely on data-driven decision-making. Particularly effective for quarterly and annual performance comparisons, competitive benchmarking, market share analysis, and strategic planning presentations.
-
Slide Structure
Two-slide set, each containing a 5-item horizontal bar chart. The first slide uses navy blue color scheme, while the second employs red and purple tones to distinguish different data sets. Description text boxes positioned at the bottom of each slide provide space for additional narrative and context.
Related Products
-

Usage Status and Trends by Application Graph - Horizontal & Vertical Bar Utilization
#Business Introduction #Market and Competitor Analysis #Graph
-

3D Vertical Graph Market Status – Premium Template for Market Analysis
#Business Introduction #Market and Competitor Analysis #Graph
-

Battery Shape Vertical Bar Graph – Competitor Analysis
#Technical Approach #Market and Competitor Analysis #Graph
-

Usage Status and Trends by Application Graph
#Business Introduction #Market and Competitor Analysis #Graph
