Basic Vertical Bar Chart Slide – Market Status Analysis
RB0800014_6
- Last Update 03/20/2025
- File Size 0.1MB
- # of Slides 2
- File Format PPTX
- Slide Ratio 4:3
- Color
Keywords
- #Content-Based Slides
- #Design-Based Slides
- #Market and Competitor Analysis
- #Financial Plans and Performance
- #Graph
- #Market Status
- #Sales and Revenue
- #Column
- #Column Chart
- #4:3
- #vertical bar chart PowerPoint
- #bar graph presentation slide
- #data comparison chart
- #market analysis template
- #financial performance visualization
About the Product
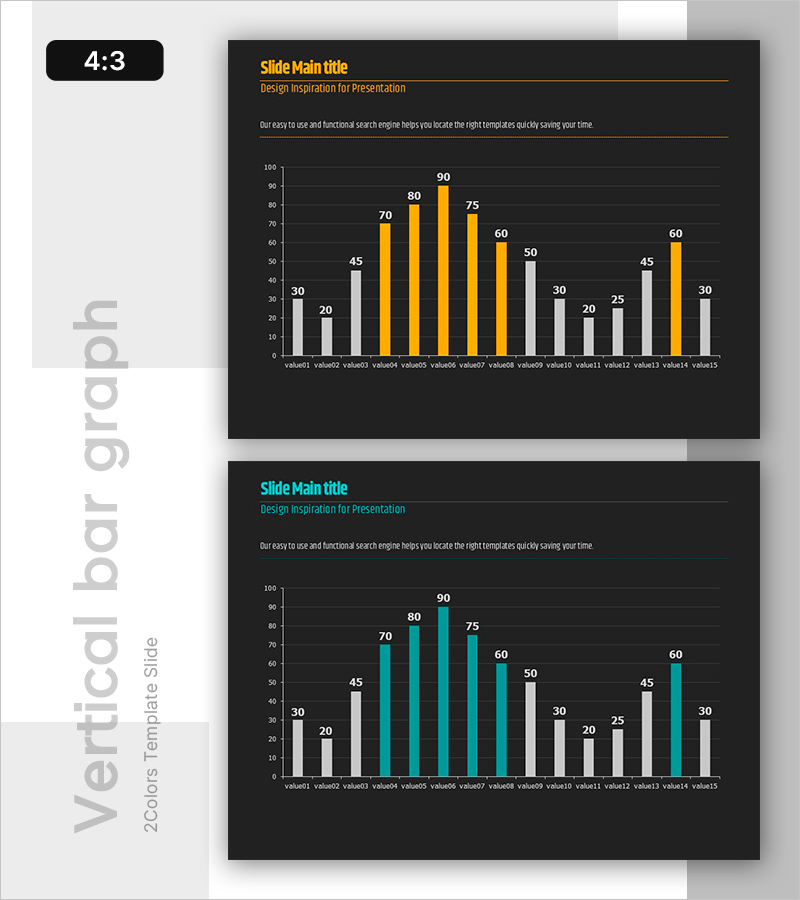
A vertical bar chart PowerPoint slide optimized for market analysis and financial performance comparison. This presentation template displays 15 data items across two contrasting series in orange and gray, enabling clear side-by-side comparison of values. The dark background with bright bars creates strong visual contrast for maximum impact during presentations. The 4:3 aspect ratio 2-slide set is ready to edit and customize for marketing analysis, sales reports, executive briefings, and business performance reviews.
Usage Points
-
Main Usage
Display and compare numerical data across two categories—such as market performance, sales figures, or financial metrics—for 15 distinct items. The dual-series design highlights key values in orange while maintaining context with gray reference data, enabling quick trend identification and comparative analysis.
-
How to Use
Ideal for sales reports, executive meetings, and marketing strategy presentations where quarterly results, regional sales, or competitive benchmarking must be communicated. The high-contrast dark background ensures clarity on projectors and large screens, while clear value labels support audience comprehension and engagement.
-
Recommended For
Finance, marketing, and sales teams presenting periodic reports and analytical findings. Particularly effective for quarterly or monthly performance reviews, product or regional sales comparisons, competitive analysis, and executive-level business briefings.
-
Slide Structure
Two-slide set with identical vertical bar chart layouts. Each slide displays 15 data items (value01–value15) in orange and gray series, with Y-axis scale (0–100) and X-axis item labels. Includes title, subtitle, and descriptive text areas for customization.
Related Products
-

Key Growth Drivers KPI Slide – Revenue, Efficiency, Customers
#Market and Competitor Analysis #Financial Plans and Performance #Graph
-

Vertical Bar Column Chart (Orange & Green) – Visualizing Sales Performance
#Market and Competitor Analysis #Financial Plans and Performance #Graph
-

Purple Green Flower Market Analysis – Market Status and Competitive Analysis
#Market and Competitor Analysis #Financial Plans and Performance #Graph
-

Simple & Modern Wide PowerPoint Vertical Bar Chart
#Market and Competitor Analysis #Financial Plans and Performance #Graph
