Simple Car Wide Presentation Line Chart – Visualizing Business Growth
RJ0200057_5
- Last Update 04/15/2025
- File Size 0.5MB
- # of Slides 2
- File Format PPTX
- Slide Ratio 16:9
- Color
Keywords
- #Content-Based Slides
- #Design-Based Slides
- #Business Introduction
- #Market and Competitor Analysis
- #Graph
- #Competitive Advantage
- #Line
- #Line Chart
- #16:9
- #line chart PowerPoint slide
- #multi-series line graph
- #business growth visualization
- #automotive industry presentation
- #data visualization PPT
- #3-series chart template
About the Product
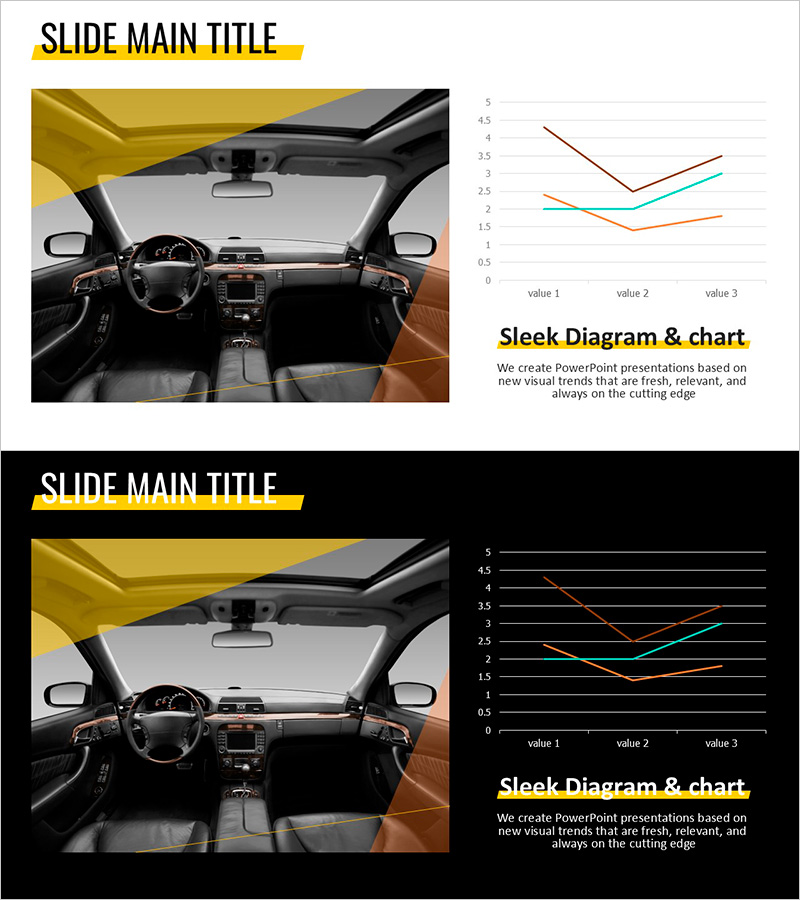
A line chart PowerPoint slide designed for automotive industry presentations. This slide features a multi-line chart with three data series (red, orange, and cyan) to visualize business growth trends, sales performance, market share changes, and key performance indicators. Two layout versions—light background and dark background—are provided to suit different presentation environments. The 16:9 widescreen format includes a professional automotive interior image paired with the chart for enhanced visual impact. Fully editable across 2 slides, ideal for quarterly reports, executive briefings, investor presentations, and strategic planning sessions.
Usage Points
-
Main Usage
Effectively display trends across three data series over time, showing growth patterns, declines, and recovery cycles. Optimized for automotive industry metrics such as sales volume, market share, customer satisfaction, and competitive benchmarking.
-
How to Use
Perfect for quarterly performance reviews, executive reports, investor presentations, and strategic planning meetings. The light background version works best in bright conference rooms, while the dark background adapts to projector-heavy environments for maximum visibility.
-
Recommended For
Automotive marketing professionals, sales teams, executives, business analysts, consultants, and financial officers presenting growth metrics, competitive analysis, and market trends to stakeholders.
-
Slide Structure
2-slide set with automotive interior imagery on the left and a 3-series line chart on the right. Chart features 3 horizontal data points (value 1, 2, 3) and a vertical axis ranging from 0 to 5. Both light and dark background versions included for flexible deployment.
Related Products
-

Pink Navy Curved Line Graph and Description
#Business Introduction #Market and Competitor Analysis #Graph
-

Car Model Revenue Comparison Analysis Graph – Insights into Market Trends
#Business Introduction #Market and Competitor Analysis #Diagram
-

The Population Graph of Animals and Plants – Visualizing Competitive Advantage
#Business Strategy #Market and Competitor Analysis #Diagram
-

Competitive Advantage Analysis Line Graph
#Market and Competitor Analysis #Graph #Competitor Analysis
