Garden Management Curve Graph
RJ0600083_24
- Last Update 07/12/2025
- File Size 0.5MB
- # of Slides 2
- File Format PPTX
- Slide Ratio 16:9
- Color
Keywords
- #Content-Based Slides
- #Design-Based Slides
- #Market and Competitor Analysis
- #Financial Plans and Performance
- #Graph
- #Competitive Advantage
- #Sales and Revenue
- #Line
- #Line Chart
- #16:9
- #line chart PowerPoint
- #dual-series trend graph
- #data comparison slide
- #line graph template
- #sales analysis PPT slide
- #how to create line chart in PowerPoint
About the Product
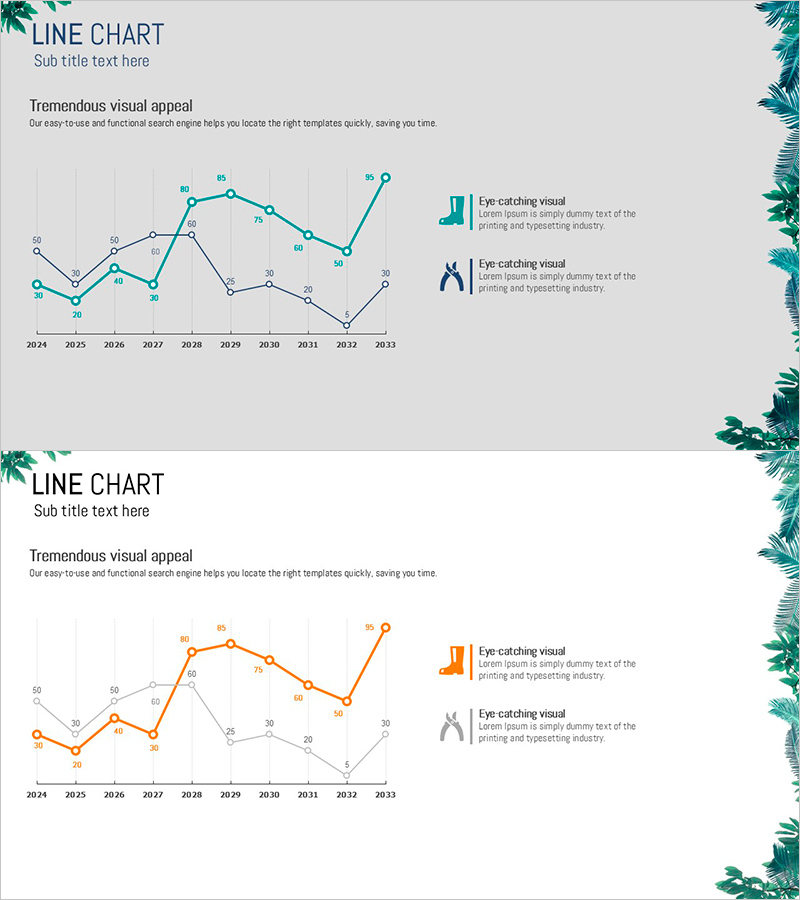
A dual-series line chart PowerPoint slide comparing 10-year data trends from 2024 to 2033. Two trend lines in teal and orange distinguish separate data series, with labeled data points ensuring precise value communication. Ideal for visualizing growth rates, competitive advantage, and market changes in business contexts such as garden management, financial planning, and sales analysis. Delivered in 16:9 widescreen PPTX format, fully editable to customize data values and adapt to your presentation needs. Includes legend and axis labels for clear interpretation.
Usage Points
-
Main Usage
Simultaneously compare two or more data indicators over extended periods to visualize growth rates, market shifts, and competitive positioning. Effectively display garden management cost trends, sales versus competitor performance, or correlations between financial metrics at a glance.
-
How to Use
Double-click data points and numerical labels to replace with your actual data. Modify series colors to match corporate branding while maintaining visual distinction, and freely edit legend and axis labels. Insert into business reports, investor presentations, and strategy meeting slides.
-
Recommended For
Finance professionals, marketing analysts, business planners, and executives presenting quarterly or annual performance reviews, market share comparisons, and budget execution status. Suitable for business plans, investor pitch decks, performance reports, and marketing strategy presentations.
-
Slide Structure
Two-slide layout. First slide features teal-colored trend line; second slide displays orange-colored trend line. Each slide includes X-axis (2024-2033), Y-axis (numeric range), labeled data points, and right-side legend with icons and descriptive text.
Related Products
-

Graph Slide Visualizing Average Monthly Eating Out Consumption Trends
#Market and Competitor Analysis #Financial Plans and Performance #Graph
-

Rising Section Blue Line Chart - Sales and Revenue Analysis
#Market and Competitor Analysis #Financial Plans and Performance #Graph
-

Slide Visualizing Sales Performance Trend in the Kids Market
#Market and Competitor Analysis #Financial Plans and Performance #Graph
-

Chair Sales Graph – Visual Data Analysis
#Market and Competitor Analysis #Financial Plans and Performance #Graph
