Business Plan Presentation Template Connection Diagram
RJ0200027_10
- Last Update 04/05/2025
- File Size 3.5MB
- # of Slides 2
- File Format PPTX
- Slide Ratio 16:9
- Color
Keywords
- #Content-Based Slides
- #Design-Based Slides
- #Business Vision and Strategy
- #Business Strategy
- #Diagram
- #Business Goals
- #Implementation Framework
- #Flow
- #Linear Flow
- #16:9
- #linear diagram PowerPoint
- #4-step connection diagram
- #business process flow slide
- #business objective diagram
- #process flow PowerPoint slide template
About the Product
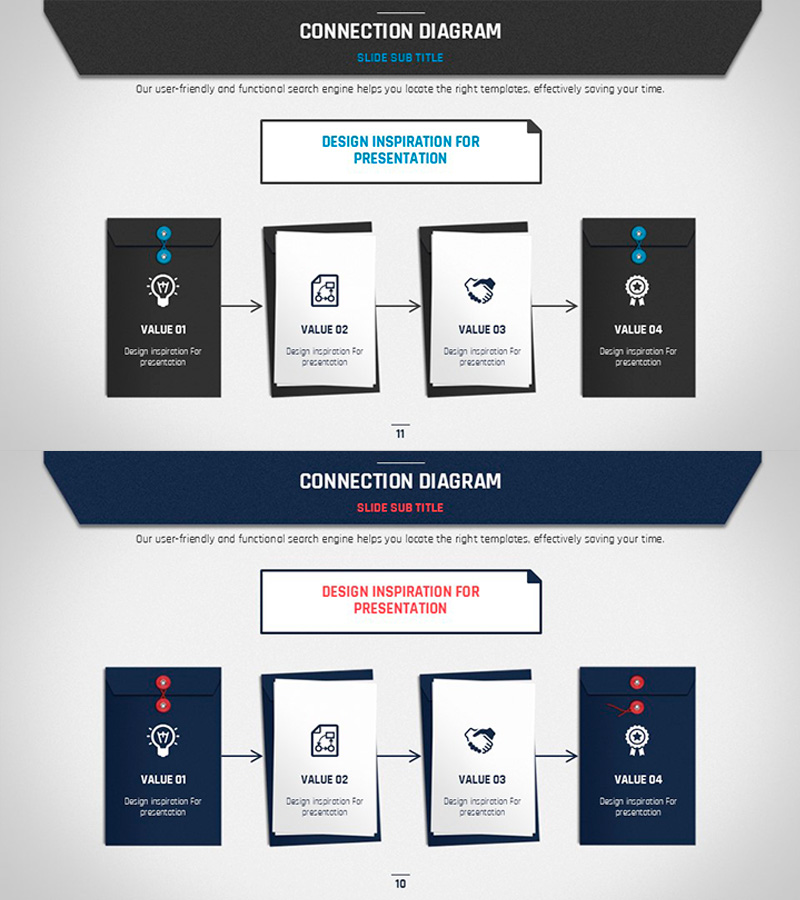
A 4-step linear connection diagram PowerPoint slide that visualizes business objectives and strategic vision in sequential stages. Featuring dark gray and dark blue backgrounds with white typography and icons, each stage represents core values such as ideation, design, collaboration, and achievement. The arrow-connected boxes clearly convey process flow, while the header area and descriptive text section enable easy presentation context setup. This 16:9 ratio, 2-slide deck is ready to use immediately for business presentations and strategic planning discussions.
Usage Points
-
Main Usage
Use this slide to explain business plans, strategic initiatives, and project phases in sequential order. It visually represents the flow from ideation to final results, enhancing audience comprehension. Each stage communicates both core values and objectives simultaneously, making complex processes easy to follow.
-
How to Use
Customize the text and icons in each box to match your presentation context. Adjust colors by modifying the background and accent colors as needed. To change the number of steps, copy or delete nodes and arrows accordingly. Fill in the title and description areas with your presentation topic to complete the slide.
-
Recommended For
Ideal for executives, planners, and project managers presenting business strategies, product development roadmaps, and organizational change initiatives. Perfect for investor pitch presentations, business plan presentations, and internal strategy meetings where process flow visualization is critical.
-
Slide Structure
2-slide deck. Each slide contains a header title area, a central 4-node linear connection structure, and a footer description text section. The first slide features a dark gray background while the second uses dark blue, providing color variation. Each node includes an icon, text label, and number, connected left-to-right with directional arrows.
Related Products
-

Visualizing Linear Process for a Successful Diet Program - Effective Strategies
#Business Vision and Strategy #Business Strategy #Diagram
-

Cluster Slide Visualizing the Pregnancy Process
#Business Strategy #Operational Plan #Diagram
-

Diagram Slide Connecting Business Strategy
#Business Strategy #Diagram #Implementation Framework
-

Goal and Strategy Arrow Diagram – Clarifying Business Objectives
#Business Vision and Strategy #Operational Plan #Diagram
