Science Experiment Goal Arrow Diagram – Steps for Successful Projects
RJ0400025_9
- Last Update 05/24/2025
- File Size 6.4MB
- # of Slides 2
- File Format PPTX
- Slide Ratio 16:9
- Color
Keywords
- #Content-Based Slides
- #Design-Based Slides
- #Business Introduction
- #Business Vision and Strategy
- #Business Strategy
- #Diagram
- #Business Goals
- #Step-by-Step Schedule Plan
- #Flow
- #Cluster
- #Linear Flow
- #Closed Cluster Diagram
- #16:9
- #arrow diagram PowerPoint
- #3-step process presentation
- #project goals slide template
- #linear flow diagram
- #process flow PowerPoint slide
About the Product
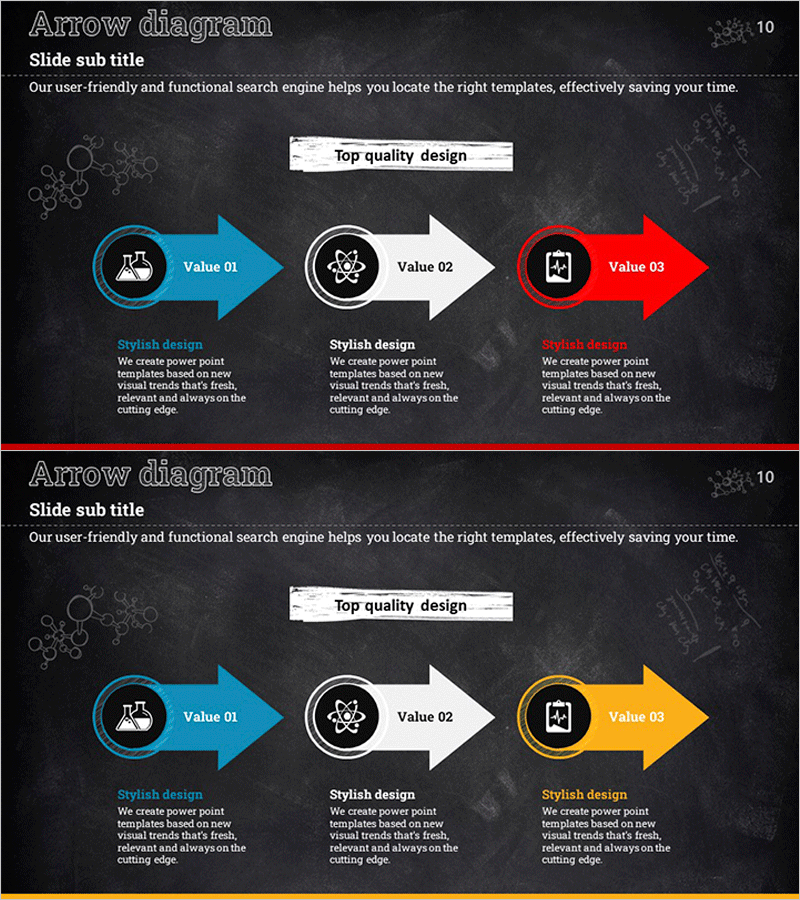
A 3-step arrow diagram PowerPoint slide that visualizes project goals and sequential progress stages. Set against a dark chalkboard background, three colored arrows (blue, white, red) flow from left to right in a linear structure, with each step featuring an icon, title, and description text area. Delivered as a 2-slide 16:9 PPTX file, ready for immediate use in science experiment presentations, project management briefings, and business vision pitches. All arrow nodes, colors, and text are fully editable to match your content and branding.
Usage Points
-
Main Usage
Presents a clear roadmap by visualizing project progression from start to completion through sequential arrows. Ideal for science experiment procedures, business implementation stages, product development workflows, and any presentation requiring linear process visualization.
-
How to Use
Customize each arrow node's icon, title, and description text to match your project stages. Modify colors to reflect your brand identity while maintaining the professional dark chalkboard aesthetic. Use as a mid-presentation section divider or core process explanation slide to enhance audience comprehension.
-
Recommended For
Project managers, scientists, researchers, business planners, and marketing professionals explaining phased implementation plans. Recommended for investor presentations, academic conferences, internal reports, and proposal pitches where structured information delivery is essential.
-
Slide Structure
Both slides feature identical 3-step arrow architecture. Each slide contains a title area at the top, three arrow nodes in the center (each with circular icon, label, and description text), and supplementary text space at the bottom. Arrows progress left-to-right, representing sequential workflow stages.
Related Products
-

Diagram for Setting Banking Service Objectives
#Business Vision and Strategy #Marketing Plan and Strategy #Diagram
-

Running Silhouette Step-by-Step Features – Innovation and Goals
#Business Vision and Strategy #Business Strategy #Diagram
-

Implementation Strategy and Goals – Business Flow and Cluster Structure
#Business Vision and Strategy #Diagram #Business Goals
-

Step-by-step Quality Assurance Plan Diagram
#Business Strategy #Business Management #Diagram
