Architectural Illustration Templates and Line Charts – Visualizing Market and Competitive Advantage
RJ0900001_19
- Last Update 08/15/2025
- File Size 0.3MB
- # of Slides 2
- File Format PPTX
- Slide Ratio 16:9
- Color
Keywords
- #Content-Based Slides
- #Design-Based Slides
- #Market and Competitor Analysis
- #Graph
- #Market Analysis
- #Competitive Advantage
- #Line
- #Line Chart
- #16:9
- #line chart PowerPoint slide
- #dual-series trend comparison
- #time-series data visualization
- #how to create line chart in PowerPoint
- #trend analysis slide template
About the Product
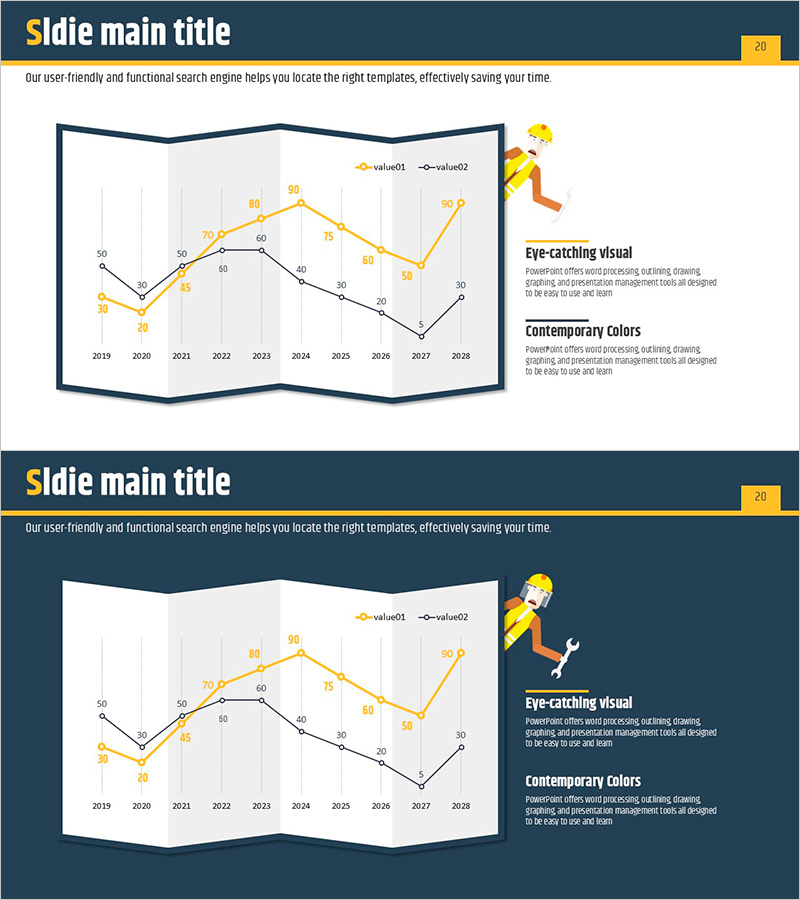
A dual-series line chart PowerPoint slide visualizing data trends from 2019 to 2028. The chart uses orange and black lines to clearly compare two data series over time, with 10 data points per series. Each slide includes supporting text areas and illustrative elements for immediate presentation use. Provided in 16:9 widescreen PPTX format with fully editable data fields, allowing you to replace values and customize labels without design constraints.
Usage Points
-
Main Usage
Simultaneously compare and visualize two data series over time, making it ideal for displaying market trends, sales performance, and key metrics. The dual-line format enables clear identification of diverging or converging patterns between datasets.
-
How to Use
Insert into business reports, quarterly performance presentations, and market analysis decks where trend comparison is essential. Double-click the chart to edit data values, update the legend labels, and modify text boxes with your key insights and conclusions.
-
Recommended For
Finance teams, marketing professionals, executives, management consultants, and data analysts who need to communicate quantitative results persuasively. Particularly effective for competitive analysis, market share evolution, and growth rate presentations.
-
Slide Structure
Two-slide set, each featuring a dual-series line chart with 10 data points per series, legend indicators (value01 and value02), left-aligned illustration element, right-aligned text box with title and description, header bar, and slide number.
Related Products
-

Trend Visualization of Surgery for Market and Competitive Analysis
#Market and Competitor Analysis #Graph #Market Analysis
-

Segmented Bar Graph and Line Graph – Ideal for Market Analysis
#Market and Competitor Analysis #Graph #Market Analysis
-

Line Chart of the Violence Survey – Market Analysis and Competitive Advantage
#Market and Competitor Analysis #Graph #Market Analysis
-

Line Chart for Visualizing Data Changes – Effective Information Delivery
#Market and Competitor Analysis #Graph #Market Analysis
