Consumer Analysis Report Chart – Understanding Your Customers
RM0400009_11
- Last Update 02/17/2025
- File Size 2MB
- # of Slides 2
- File Format PPTX
- Slide Ratio 16:9
- Color
Keywords
- #Content-Based Slides
- #Design-Based Slides
- #Company Introduction
- #Market and Competitor Analysis
- #Diagram
- #Graph
- #Business Areas
- #Customer Analysis
- #Horizontal Bar
- #Horizontal Bar Chart
- #16:9
- #horizontal bar chart PowerPoint
- #customer analysis slide template
- #data visualization chart
- #market research graph
- #customer segmentation PPT template
About the Product
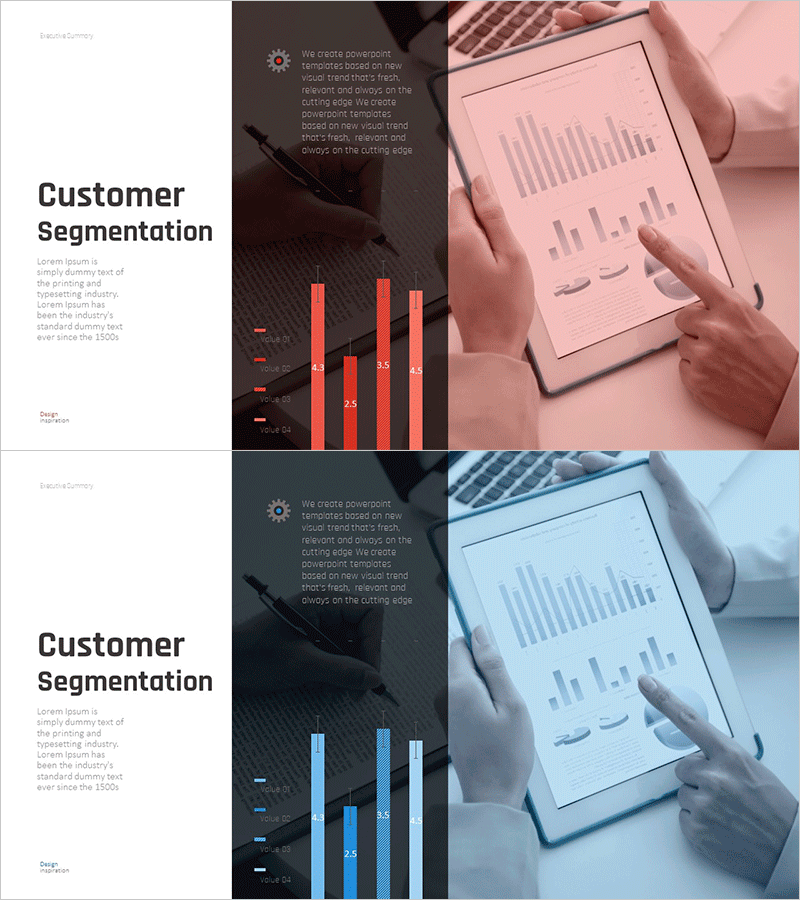
A horizontal bar chart PowerPoint slide designed for customer segmentation analysis. This 2-slide set features pink and blue color schemes, with each slide clearly comparing numerical data across four customer categories. Ideal for consumer analysis reports, market research presentations, and customer insight sharing. The bar lengths intuitively represent numerical differences, making it perfect for immediate use in customer segment performance comparison and market analysis decks.
Usage Points
-
Main Usage
This slide clearly communicates customer segmentation analysis results through quantitative data visualization. Use it for market research, consumer behavior analysis, customer satisfaction comparisons, and other data-driven customer insights.
-
How to Use
Adjust each bar length to input actual data values. Use the pink slide for female customer segment analysis and the blue slide for male customer segment analysis, or customize by other demographic criteria. Add legends and numerical labels to enhance information clarity.
-
Recommended For
Marketing managers, market research analysts, sales strategy planners, and executives presenting customer data-driven decisions. Ideal for quarterly customer analysis reports, new product target audience analysis, and customer satisfaction survey result presentations.
-
Slide Structure
Slide 1 (Pink tone): Title area + 4-item horizontal bar chart + legend / Slide 2 (Blue tone): Same structure for different customer segment data. Each bar is set to 0-100% range with editable data labels.
Related Products
-

Consumer Response Analysis and Improvement Summary Table
#Company Introduction #Market and Competitor Analysis #Diagram
-

Work Capabilities Analysis Diagram – Analysis of Key Personnel Work Performance
#Company Introduction #Market and Competitor Analysis #Diagram
-

Customer Behavior Analysis by Country – Strategic Business Proposal
#Business Strategy #Market and Competitor Analysis #Diagram
-

Pie Slice Circle Diagram - A Quick Look at Customer Segmentation
#Company Introduction #Market and Competitor Analysis #Diagram
