This Unique Challenge Graph – Capturing Growth
RJ0500037_9
- Last Update 06/17/2025
- File Size 3.6MB
- # of Slides 2
- File Format PPTX
- Slide Ratio 16:9
- Color
Keywords
- #Content-Based Slides
- #Design-Based Slides
- #Market and Competitor Analysis
- #Marketing Plan and Strategy
- #Graph
- #Customer Analysis
- #Target Setting
- #Horizontal Bar
- #Horizontal Bar Chart
- #16:9
- #horizontal bar chart PowerPoint
- #bar graph slide template
- #growth metrics chart
- #data comparison slide
- #marketing report PowerPoint
About the Product
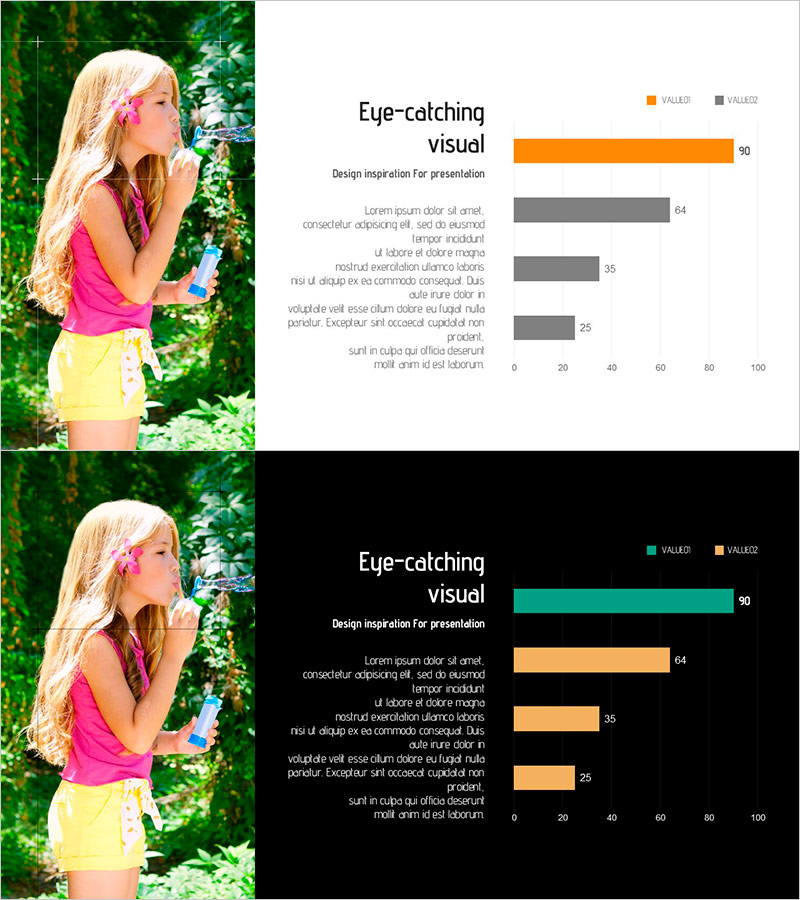
A horizontal bar chart PowerPoint slide designed to visualize growth metrics and comparative data across four categories. The slide features contrasting orange and gray color schemes that clearly distinguish between primary and secondary values, with a 0-100 horizontal axis for intuitive data interpretation. The balanced left-right layout combines an image area with the chart section, making it ideal for sales reports, marketing strategy presentations, and market analysis decks. Provided in 2-slide PPTX format with 16:9 aspect ratio, fully editable for custom text and numerical values.
Usage Points
-
Main Usage
Ideal for presenting quantitative comparisons across four categories such as sales growth, market share, performance metrics, or competitive analysis. The horizontal bar layout allows viewers to quickly assess relative values and identify trends, making it perfect for executive briefings, investor presentations, and strategic planning sessions.
-
How to Use
Place product imagery or brand visuals in the left image area, then edit the category labels and numerical values in the right chart section. Use the orange bars to highlight primary metrics and gray bars for comparative benchmarks, allowing flexible visual emphasis based on presentation context.
-
Recommended For
Marketing managers, sales directors, business analysts, management consultants, and financial professionals presenting quarterly performance reviews, competitive benchmarking, market trend analysis, and data-driven decision-making reports.
-
Slide Structure
2-slide deck with 16:9 aspect ratio featuring a left-right split layout. Left side contains a full-height image area; right side displays title, descriptive text, and a 4-item horizontal bar chart with 0-100 scale. Two data series (orange VALUE1 and gray VALUE2) enable side-by-side category comparison.
Related Products
-

User Gender Ratio Analysis – Market Insights
#Market and Competitor Analysis #Graph #Customer Analysis
-

Space Industry Analysis Graph Chart – Market and Competitive Analysis
#Market and Competitor Analysis #Graph #Customer Analysis
-

Customized Analysis Strategy by Audience Type – Secrets of Market-Driven Marketing
#Market and Competitor Analysis #Marketing Plan and Strategy #Diagram
-

Customer Analysis Visualization with Horizontal Bar Chart
#Market and Competitor Analysis #Graph #Customer Analysis
