Market Demand Analysis PowerPoint Slide – Donut Chart Layout
RJ0300105
- Last Update 06/08/2026
- File Size 12MB
- # of Slides 2
- File Format PPTX
- Slide Ratio 16:9
- Color
Keywords
- #Content-Based Slides
- #Design-Based Slides
- #Market and Competitor Analysis
- #Graph
- #Customer Analysis
- #Market Analysis
- #Horizontal Bar
- #Circles
- #Horizontal Bar Chart
- #Doughnut Chart
- #16:9
- #market demand analysis PowerPoint slide
- #donut chart presentation slide
- #market size growth potential slide deck
- #competitor market share PowerPoint
- #data-driven market analysis PPT
About the Product
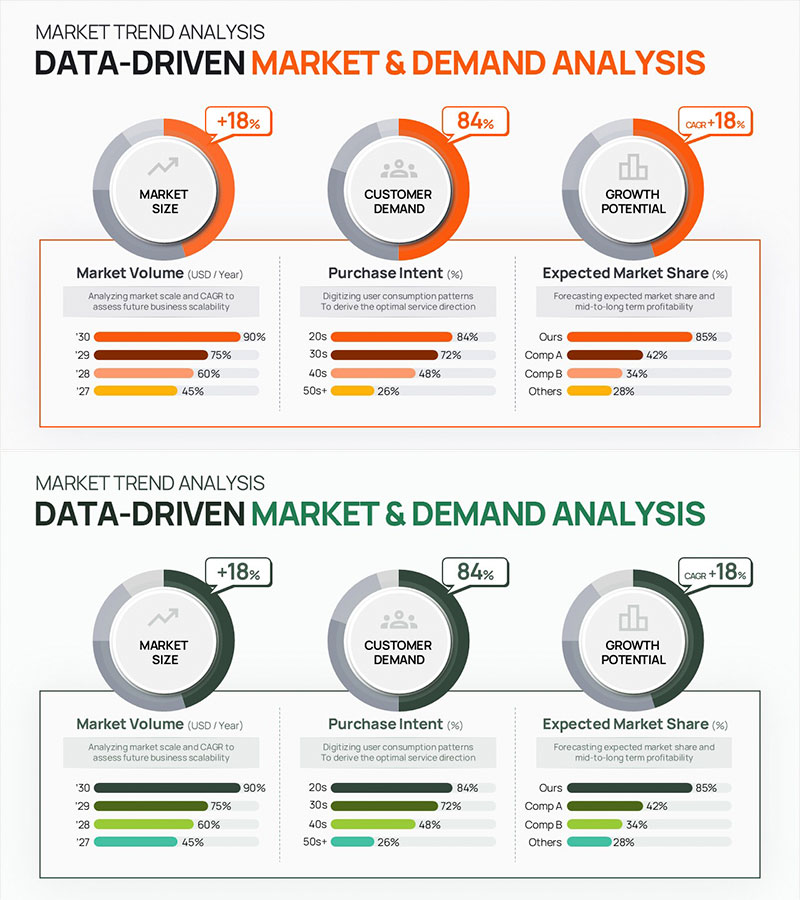
A market and demand analysis PowerPoint slide presenting three core KPIs — Market Size (+18%), Customer Demand (84%), and Growth Potential (CAGR +18%) — in a single structured layout. The upper section features three donut charts with percentage callouts, while the lower 3-column grid uses horizontal bar charts to compare market volume by year (2027–2030), purchase intent by age group, and expected competitive market share. Two color schemes — dark green and orange — on a white background let presenters match their brand or presentation tone. Ideal for investor meetings, IR pitches, market entry strategy reports, and business plan slides. Fully editable in PowerPoint; replace placeholder data with real figures for immediate use.
Usage Points
-
Main Usage
For investor meetings, IR pitches, and market entry reports requiring data-driven visualization of market size, customer demand, and growth potential in one impactful slide.
-
How to Use
Edit the donut charts and bar graphs directly in PowerPoint with your own market figures. Choose the dark green or orange color version to match your presentation or brand guidelines.
-
Recommended For
Startup founders, investment analysts, business strategists, and marketing managers who present market data for investor decks, market research reports, or new business planning.
-
Slide Structure
Single 16:9 slide with 3 donut charts (Market Size, Customer Demand, Growth Potential) in the upper section and a 3-column bar chart grid below. Available in dark green and orange.
Related Products
-

Graph of Sex Ratio Analysis by Year – Data Visualization and Insights
#Market and Competitor Analysis #Graph #Customer Analysis
-

Stylish Design Business Presentation Template
#Market and Competitor Analysis #Graph #Market Status
-

Separate Recycling Implementation Rate Survey Donut Chart – Visualized in Blue and Green
#Market and Competitor Analysis #Graph #Customer Analysis
-

Premium Coffee Customer Demographics and Popular Menu – Comprehensive Customer Analysis
#Market and Competitor Analysis #Customer Success Stories #Graph
