SNS Main Service Analysis 3D Area Graph – Market Status and Competitive Advantage
RJ0400054_25
- Last Update 06/01/2025
- File Size 2.3MB
- # of Slides 2
- File Format PPTX
- Slide Ratio 16:9
- Color
Keywords
About the Product
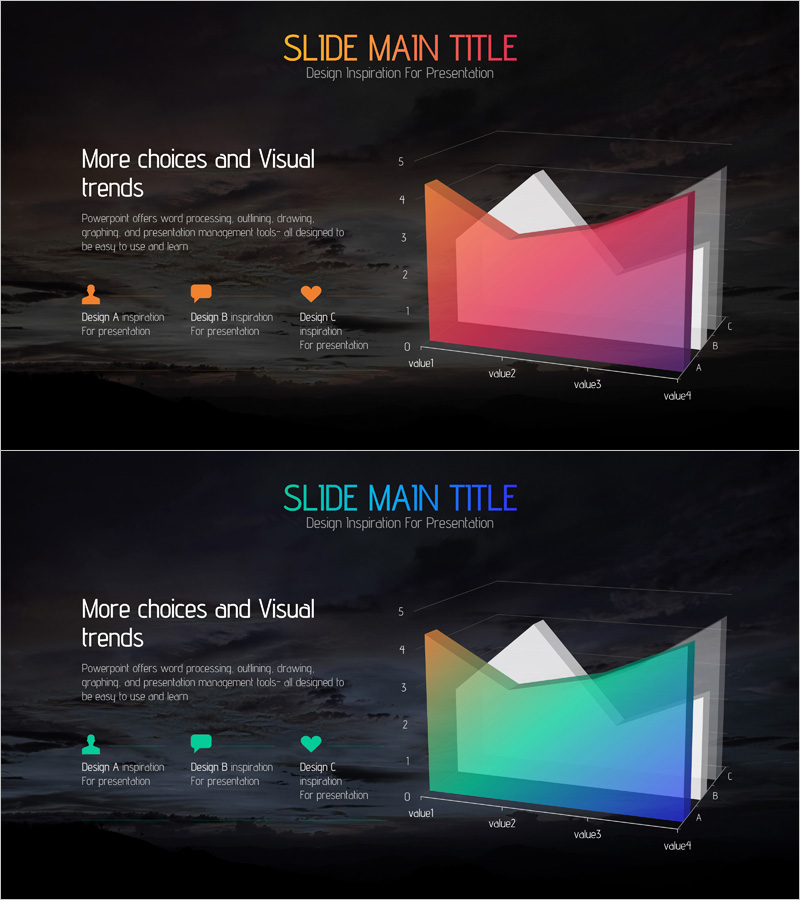
This slide visually presents a 3D area graph for the analysis of key services in social networking. The graph effectively illustrates quantitative comparisons among different services, with an attractive blend of purple and blue colors that capture attention. Ideal for market and competitor analysis contexts, it aids audience understanding through visual emphasis of data. It includes easily replaceable elements with a medium level of editing difficulty.
Usage Points
-
Main Usage
- This template serves well for presenting comparative analyses of social networking services during market research presentations. It allows for clear visualization of data, facilitating discussions on service performance among stakeholders in strategic meetings.
-
How to Use
- Use this template to create insightful reports for internal teams looking to assess competitor performance. It can also be utilized in client presentations to provide a visual representation of market positioning and service effectiveness, enhancing understanding of complex data.
-
Recommended For
- This slide set is ideal for marketing analysts, business strategists, and team leaders involved in competitive analysis. It is particularly useful for those preparing for strategy sessions or workshops aimed at evaluating and improving service offerings.
-
Slide Structure
- The overall structure includes an introductory slide that outlines the focus of the analysis, followed by detailed slides that break down specific services, concluding with a summary slide that highlights key insights. This sequence aids in guiding the audience through the analysis logically.
Related Products
-

Natural Landscape Illustration Graph – Market Status and Competitive Advantage
#Market and Competitor Analysis #Graph #Other
-

Study Area Chart - Market Status and Competitive Advantage
#Market and Competitor Analysis #Graph #Other
-

Area Chart for Science Topics – Gain Competitive Advantage through Data Analysis
#Market and Competitor Analysis #Graph #Other
-

Bar Chart Visualizing Yacht Tour Satisfaction
#Market and Competitor Analysis #Graph #Other
