Meat and Vegetable Consumption by Region – Market Status Analysis
RJ0800051_25
- Last Update 08/14/2025
- File Size 2.3MB
- # of Slides 2
- File Format PPTX
- Slide Ratio 16:9
- Color
Keywords
- #Content-Based Slides
- #Design-Based Slides
- #Market and Competitor Analysis
- #Graph
- #Other
- #Market Status
- #Competitive Advantage
- #Horizontal Bar
- #Horizontal Bar Chart
- #Map
- #16:9
- #USA map PowerPoint slide
- #regional distribution chart
- #food distribution map template
- #market analysis slide download
- #geographic data visualization PowerPoint
About the Product
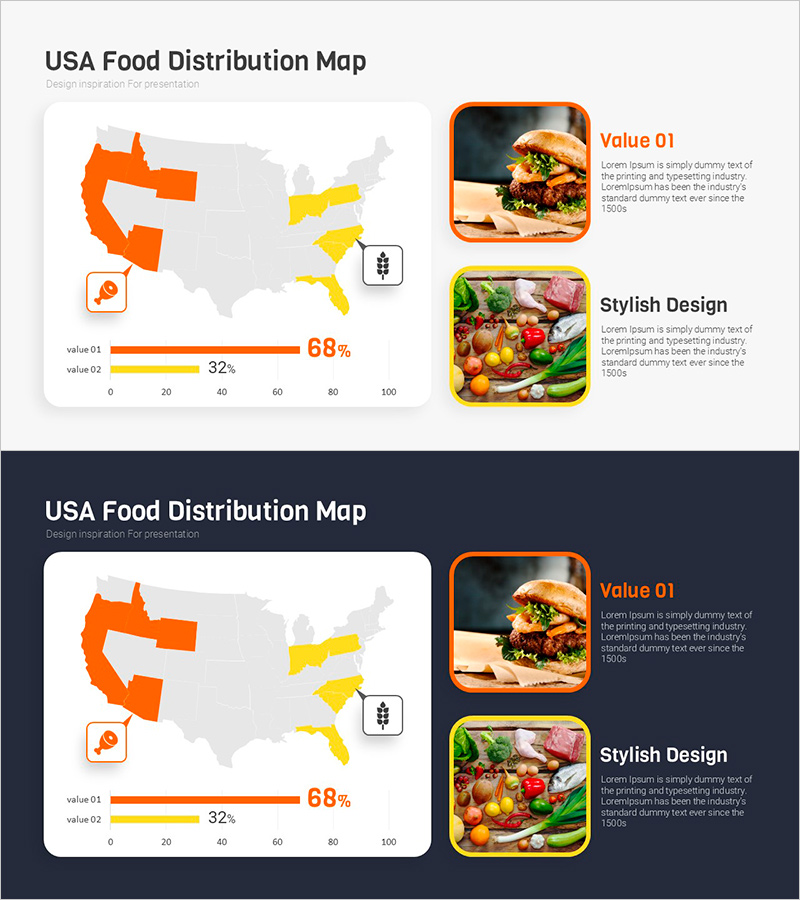
A PowerPoint slide that visualizes food distribution across the United States by region using a color-coded map. The design combines an orange and yellow two-color regional map with a horizontal bar chart showing 68% and 32% market share distribution, enabling simultaneous representation of market penetration and geographic spread. Provided in 16:9 widescreen format with 2 slides featuring both light and dark background versions for flexible presentation styling. This template is ready to use for business reports, market analysis presentations, regional sales performance briefings, and food industry distribution network discussions.
Usage Points
-
Main Usage
Designed to communicate regional market share, sales volume distribution, and distribution network status through geographic visualization. The map divides the entire USA by color coding while parallel bar graphs display numerical data, enabling intuitive cross-regional comparison and analysis.
-
How to Use
Apply this template to the market overview section of business reports, regional sales strategy presentations, and distribution expansion plan briefings. Simply input your text and numerical data into the map and chart areas. Select either the light or dark background version depending on your presentation environment and corporate branding.
-
Recommended For
Marketing teams in food and agricultural industries, regional sales managers, market research report writers, business expansion presenters, and executives responsible for regional network development.
-
Slide Structure
Two-slide set with Slide 1 featuring a light background, USA map with orange and yellow regional emphasis, horizontal bar chart displaying 68% and 32% values, and legend icons. Slide 2 provides the identical layout with a dark background for flexible presentation tone selection.
Related Products
-

Market Analysis Visualization with Horizontal Bar Chart – Emphasizing Competitive Advantage
#Market and Competitor Analysis #Graph #Market Status
-

India Travel-Related Business Overview and Market Share – Market Status Analysis
#Market and Competitor Analysis #Graph #Market Status
-

Test Tube Bar Graph for Market Analysis – Highlighting Competitive Advantage
#Market and Competitor Analysis #Graph #Market Status
-

Eco Market Analysis Graph – Visualizing Competitive Advantage Data
#Market and Competitor Analysis #Graph #Market Status
