Diagram of Delivery Progress by Year – Visualization of Progress Over Time
RJ0400046_17
- Last Update 05/29/2025
- File Size 0.5MB
- # of Slides 2
- File Format PPTX
- Slide Ratio 16:9
- Color
Keywords
- #Content-Based Slides
- #Design-Based Slides
- #Company Introduction
- #Product/Service Introduction
- #Diagram
- #History
- #Development Plan
- #Cluster
- #Combination Diagram
- #16:9
- #overlapping circle diagram PowerPoint
- #year-over-year timeline slide
- #temporal progress visualization
- #circular timeline template
- #timeline diagram PowerPoint slide
About the Product
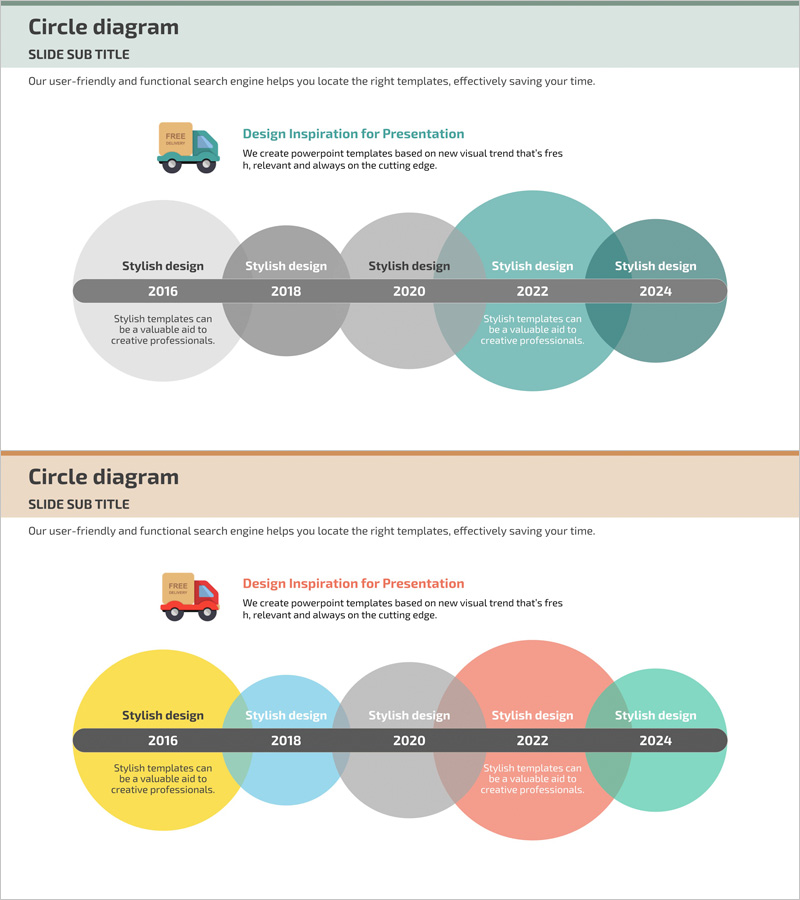
A multi-layered circle diagram PowerPoint slide that visualizes delivery progress across five years from 2016 to 2024. Overlapping circular nodes in gray, teal, yellow, and pink tones represent each year, with a central timeline axis anchoring the temporal progression. Descriptive text areas positioned above and below each node enhance information clarity and storytelling impact. Ideal for company history presentations, product development timelines, business performance reports, and strategic milestone communications. The 16:9 widescreen format with 2-slide composition adapts seamlessly to modern presentation environments and corporate settings.
Usage Points
-
Main Usage
Communicate step-by-step development over time using overlapping circular nodes arranged along a central timeline axis. Effectively convey company milestones, product evolution, and business performance changes through intuitive visual hierarchy and temporal sequencing.
-
How to Use
Apply in company overview presentations to highlight key milestones from founding to present, or in project status reports to show phase-by-phase progress along a timeline. Customize node text and colors to match your specific data, and adjust text areas to emphasize critical information at each stage.
-
Recommended For
Suited for executives, marketing teams, product development managers, and sales professionals presenting company introductions, product launch histories, business performance reports, and project progress updates. Particularly effective for strategy presentations and growth narrative communications.
-
Slide Structure
Two-slide set featuring overlapping circular nodes (2016, 2018, 2020, 2022, 2024) arranged along a central horizontal timeline axis. First slide uses gray and teal color palette; second slide uses yellow, pink, and teal. Each node includes two text input areas (above and below), providing 10 total information entry points for customization.
Related Products
-

History of AI Robot Development – Journey of Technological Innovation
#Company Introduction #Diagram #History
-

Differentiation Strategy for Eco-Friendly Business – Real Product/Service Case
#Product/Service Introduction #Diagram #Differentiation Strategy for Products/Services
-

History Overlay Diagram – Company Introduction Slide
#Company Introduction #Diagram #History
-

Historical History Diagram by Year – Business Strategy and Vision
#Company Introduction #Business Strategy #Diagram
