Company History Linear Diagram – A Clear View of Business Progress
RJ0600005_7
- Last Update 06/22/2025
- File Size 2.6MB
- # of Slides 2
- File Format PPTX
- Slide Ratio 16:9
- Color
Keywords
- #Content-Based Slides
- #Design-Based Slides
- #Company Introduction
- #Diagram
- #History
- #Cluster
- #Combination Diagram
- #Chain Diagram
- #16:9
- #linear diagram PowerPoint
- #monthly progress diagram slide
- #6-stage flowchart PowerPoint
- #business timeline PPT
- #company history diagram slide
- #project progression flow template
About the Product
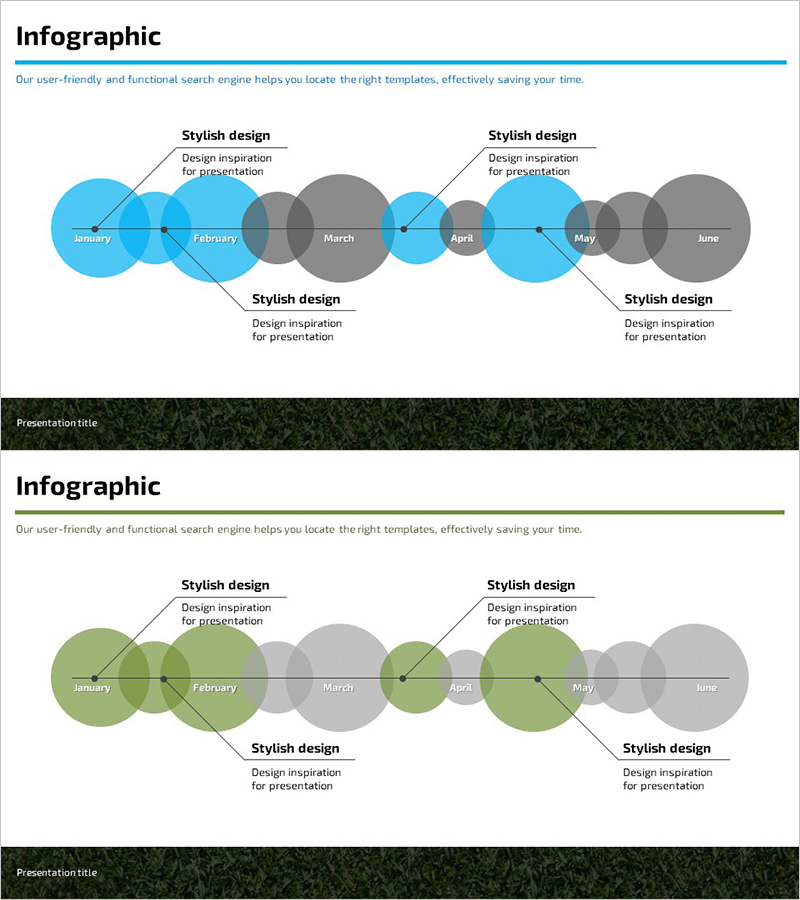
A linear diagram PowerPoint slide that visualizes a 6-month business progression process. Blue and gray circular nodes represent monthly stages, with overlapping circles clearly showing the connection between each stage. Speech bubble text boxes allow you to add stage-specific descriptions, making this presentation slide ready for immediate use. This PPT diagram is ideal for all documents requiring sequential information delivery, such as company history, project timelines, and business development phases.
Usage Points
-
Main Usage
Clearly visualizes business development stages, company history, and project timelines in chronological order. Designed to display a 6-month or 6-stage progression process linearly, enabling audiences to grasp sequential flow at a glance.
-
How to Use
Enter monthly or stage-specific titles in each circular node, and describe key achievements, activities, or goals in the speech bubble text boxes. Modify colors to distinguish importance or categories, and use arrows and connecting lines to emphasize cause-and-effect relationships between stages.
-
Recommended For
Recommended for executive reports, company profile presentations, business plans, investor pitch decks, marketing strategy documents, and project proposals—particularly when explaining company history, growth stages, or strategic execution roadmaps.
-
Slide Structure
2-slide layout. The first slide features 6 blue nodes (January–June) and 3 gray nodes overlapping and connected, with 4 speech bubble text boxes positioned at top and bottom. The second slide repeats the identical structure in green tones, providing a color variation option.
Related Products
-

History Overlay Diagram – Company Introduction Slide
#Company Introduction #Diagram #History
-

Historical History Diagram by Year – Business Strategy and Vision
#Company Introduction #Business Strategy #Diagram
-

Company History Mini Diagram – Clear and Concise Timeline
#Company Introduction #Diagram #History
-

Business History Connection Diagram – Company Growth Story
#Company Introduction #Diagram #History
