Historical History Diagram by Year – Business Strategy and Vision
RJ0600064_4
- Last Update 07/07/2025
- File Size 0.4MB
- # of Slides 2
- File Format PPTX
- Slide Ratio 16:9
- Color
Keywords
- #Content-Based Slides
- #Design-Based Slides
- #Company Introduction
- #Business Strategy
- #Diagram
- #History
- #Roadmap
- #Cluster
- #Combination Diagram
- #Chain Diagram
- #16:9
- #connected timeline diagram PowerPoint
- #historical milestones slide template
- #year-by-year business diagram
- #corporate strategy presentation
- #node-based diagram
- #business timeline slide
About the Product
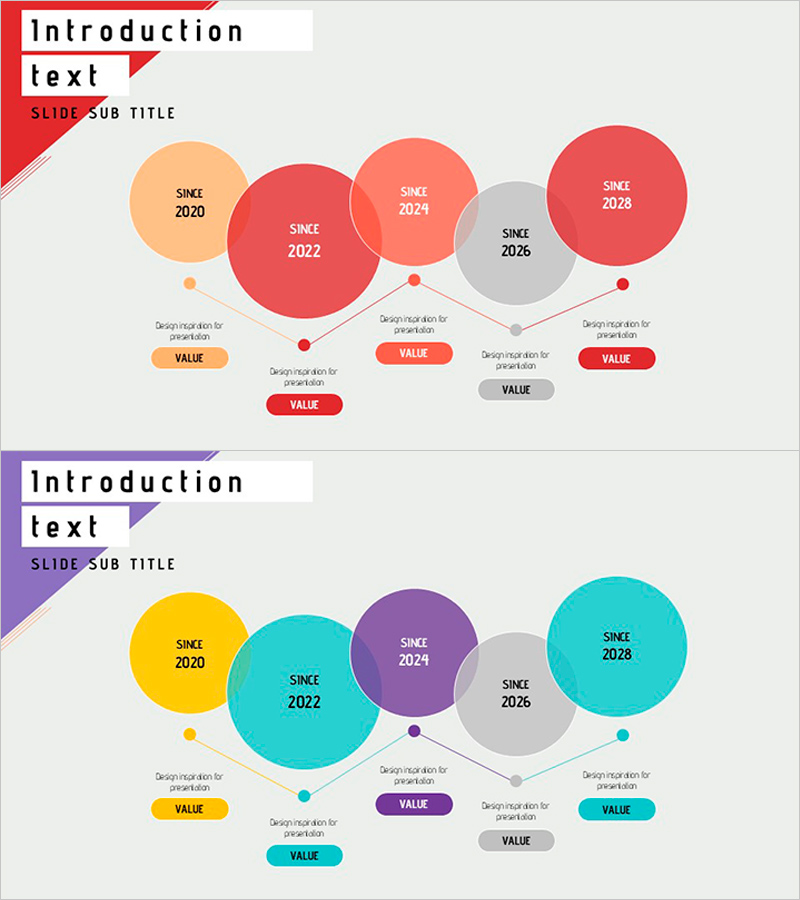
A connected timeline diagram PowerPoint slide that visualizes year-by-year business milestones and corporate vision. Five circular nodes are linked by connecting lines to represent progressive development stages over time. The design features a warm color palette of orange, red, and gray, with VALUE labels and description text areas positioned below each node. This presentation slide is ready to use for company introductions, business strategy presentations, organizational growth narratives, and corporate history overviews. The 2-slide set includes color variations in red and blue tones, allowing customization to match your corporate brand identity.
Usage Points
-
Main Usage
Designed to visually represent a company's year-by-year business history, growth trajectory, and strategic milestones. The node-based structure emphasizes key achievements and values for each period, while linear connections clearly convey temporal flow and cause-effect relationships.
-
How to Use
Apply this slide in company introduction presentations (company history section), business strategy presentations (implementation process), and investor pitch decks (growth narrative). Edit node text and VALUE labels with actual years and achievements, then adjust colors to align with your corporate brand guidelines.
-
Recommended For
Ideal for corporate executives, marketing professionals, and business development teams presenting company history and vision. Particularly effective for startups showcasing growth milestones, large corporations explaining business diversification, and organizations communicating restructuring initiatives to employees and stakeholders.
-
Slide Structure
2-slide set with first slide in orange, red, and gray tones; second slide in yellow, cyan, and purple tones. Each slide features 5 circular nodes (progressively increasing in size) connected by lines, with description text areas and VALUE badges positioned below each node. Provided in 16:9 widescreen format.
Related Products
-

Cluster Diagram Slide for Event Planning – Strategic Roadmap
#Company Introduction #Business Strategy #Diagram
-

History and Roadmap Slide – Business Strategy and Growth
#Company Introduction #Business Strategy #Diagram
-

Infographic Year Flow – Emphasizing Business Strategy
#Company Introduction #Business Strategy #Diagram
-

The History of Buttons – Business Strategy
#Company Introduction #Business Strategy #Diagram
