Farm Key Financial Indicators Table Chart – Intuitive Presentation of Financial Performance
RJ0600019_16
- Last Update 06/25/2025
- File Size 0.4MB
- # of Slides 2
- File Format PPTX
- Slide Ratio 16:9
- Color
Keywords
- #Content-Based Slides
- #Design-Based Slides
- #Financial Plans and Performance
- #Diagram
- #Sales and Revenue
- #Key Financial Indicators
- #Table
- #Standard Table
- #16:9
- #financial indicators table PowerPoint
- #farm financial slide template
- #comparison analysis table
- #data presentation PPT slide
- #financial metrics chart
- #agricultural business presentation
About the Product
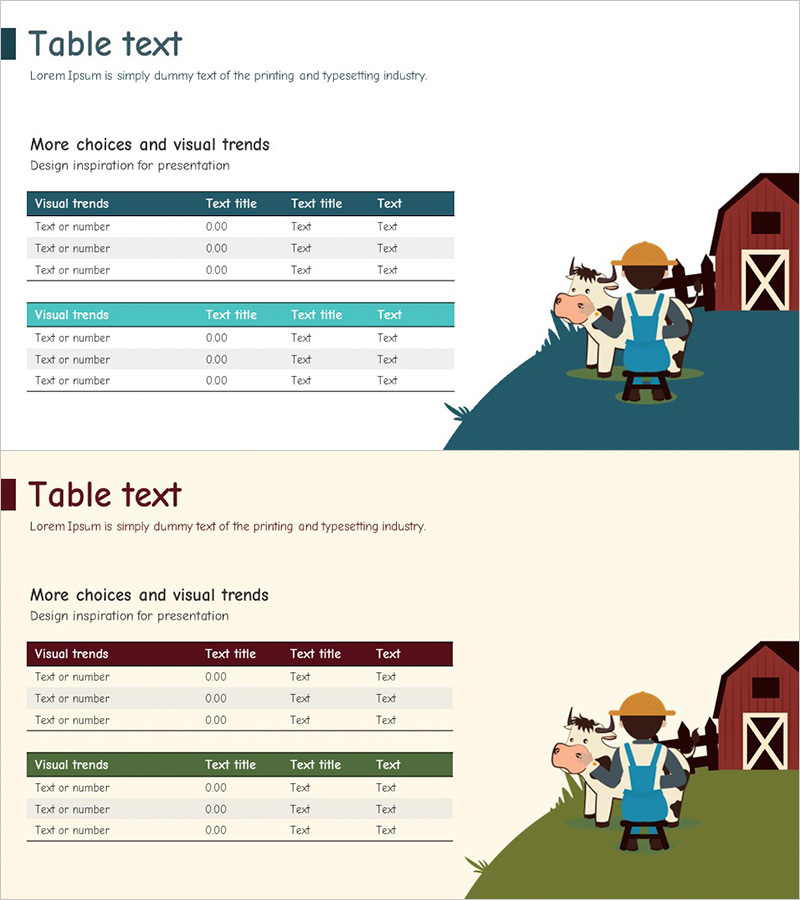
A professional table-based PowerPoint slide designed to present key financial metrics for farms and agricultural businesses with clarity and impact. The slide features two distinct color schemes—navy blue and turquoise headers—to visually separate different financial indicator categories. Each table contains four columns (Visual trends, Text title, Text title, Text) and three data entry rows, accommodating both numerical values and descriptive text. This layout is ideal for financial performance analysis, profitability comparisons, cost structure breakdowns, and budget reviews. The 2-slide set provides color variations to maintain presentation consistency while effectively establishing information hierarchy. Farm illustration on the right reinforces the agricultural context and adds visual interest.
Usage Points
-
Main Usage
Designed to clearly present agricultural business financial status, profitability analysis, and cost structures in tabular format. The navy blue and turquoise headers visually distinguish different financial indicator categories, enhancing audience comprehension and engagement during presentations.
-
How to Use
Enter financial indicator category names in the table headers and input specific numerical values and item descriptions in the data rows. The first slide features navy blue headers while the second uses turquoise, allowing flexible selection based on presentation flow and color scheme preferences.
-
Recommended For
Farm managers, agricultural finance professionals, investment presentation speakers, business plan authors, financial reporting departments. Particularly suitable for bank loan applications, investor briefings, executive reports, and presentations where financial credibility is paramount.
-
Slide Structure
2-slide set. Each slide contains a title area and two independent tables. Each table comprises a color-coded header (navy blue or turquoise), 4 columns, 3 data rows, and a bottom dividing line. A farm illustration positioned on the right side reinforces the agricultural theme and provides visual context.
Related Products
-

Grain Yield Table – Financial Planning and Performance
#Financial Plans and Performance #Diagram #Sales and Revenue
-

Quality PowerPoint Table Template for Financial Performance Visualization
#Financial Plans and Performance #Diagram #Sales and Revenue
-

Effective Data Table Slide – Financial Planning and Performance
#Financial Plans and Performance #Diagram #Sales and Revenue
-

Colors Theme Presentation Template Table – Financial Planning and Performance
#Financial Plans and Performance #Diagram #Sales and Revenue
